文献1(2020):Effect of trace carbon on the dynamic compressive properties in the as-cast
Ti13V11Cr3Al alloy(微量碳对铸态Ti13V11Cr3Al合金动态压缩性能的影响)
Fig. 1 shows the microstructural morphology of the Ti13V11Cr3Al
titanium alloy. The average grain sizes of the as-cast and heat-treated
alloys remain essentially the same (i.e., ~700–800 μm), as shown in
Fig. 1(a) and (d). Trace in-situ spherical precipitates (size: 3–4 μm) are
uniformly distributed inside the grains in the as-cast alloy, whereas
inhomogeneous distribution occurs for the heat-treated alloy (see Fig. 1
(b) and (e), respectively). Furthermore, the grains of the heat-treated
alloy are divided into smaller structures by relatively more precipitates
than the as-cast alloy. The precipitates accumulate along the
grain boundaries before and after the heat treatment, exhibiting a
necklace shape. Fig. 1(c) shows a magnified view of the region enclosed
in the red circle (see Fig. 1(b)). The dispersive distribution of relatively
fine nanoscale precipitates is observed.
![]()
Fig. 1. Microstructural morphology of the Ti13V11Cr3Al titanium alloy: (a) OM
image at a magnification of 25 × , as-cast, (b) SEM image at a magnification of 500 × , as-cast,
(c) SEM image at a high-magnification (50k × ) of region enclosed in the red circle
shown in (b), (d) OM image at a magnification of 25 × , heat-treated,
(e) SEM image at a magnification of 500 × , heat-treated.
ASB is considered a precursor for titanium alloy failure under high
strain rates. To validate the deduction that in-situ trace TiC is beneficial
to improve dynamic plasticity, the stop rings are used to control strains
for the as-cast Ti13V11Cr3Al titanium alloy under dynamic compression
loading. An ASB-containing sample (representing the onset of failure) at
a strain of ε = 31% is obtained. Fig. 8(a) shows that the main crack is
initiated and then propagates along a 45° shear direction. ASBs are
observed in the areas where the crack coalescence is insufficient,
showing a white-etching band. Fig. 8(b) shows a high-magnification
image of the region enclosed in the yellow ellipse (see Fig. 8(a)). A
width of ~10 μm is determined for the ASB. Fig. 8(c) shows a highmagnification
image of the region enclosed in the red ellipse (see
Fig. 8(b)). The interface debonding behavior occurs between nanoprecipitates
and matrix, thereby resulting in microscopic grooves in
the ASB. This indicates that the TiC precipitates will be pulled out from
the matrix by overcoming the friction resistance of the interface.
Therefore, considerable energy dissipation is required before the rapid
propagation of the main crack, thereby suppressing premature failure
and improving the dynamic plasticity of the as-cast Ti13V11Cr3Al titanium
alloy. Furthermore, the microstructure comprising the crack tip
is revealed by a magnified view (see Fig. 8(d)) of the region enclosed in
the blue ellipse (see Fig. 8(b)).
![]()
Fig. 8. Microstructural evolution of the ASB: SEM image obtained at a
magnification of (a) 100 × , (b) 1500 × , presenting a magnified view of the region enclosed in
the yellow ellipse shown in (a), (c) and (d) 20k × , presenting a magnified view of the regions
enclosed in the red and blue ellipses, respectively, shown in (b).

Effect of trace carbon on the dynamic compressive properties in the as-cast Ti13V11Cr3Al
alloy
Intermetallics 123 (2020) 106818
[ PDF
Document Download ]
文献2(2020):Ti-4.5Mo-5.1Al-1.8Zr-1.1Sn-2.5Cr-2.9Zn 钛合金
的动态力学性能及失效研究(Dynamic Mechanical Properties and Failure of Ti-4.5Mo-5.1Al-1.8Zr-1.1Sn-2.5Cr-2.9Zn
Alloy)
轧制态及热处理态钛合金的微观组织如图6 和图7
所示。在2 种状态钛合金的组织中均发现了绝热剪切
带,且裂纹与绝热剪切带的形成和扩展方向一致,由此
可知导致试样断裂的裂纹与绝热剪切带密切相关。轧制态钛合金在动态变形失效后的微观组织如图
6 所示,绝热剪切带为直线形态,且出现分叉现象,
主绝热剪切带的宽度约为5 μm,绝热剪切带内部产生
较多微裂纹,并有互相连接的趋势。
![]()
图6 轧制态钛合金中的绝热剪切带
热处理态钛合金
在动态变形失效后的微观组织如图7 所示,绝热剪切
带无交叉或交汇现象,主绝热剪切带宽度约为4 μm,
绝热剪切带内部产生较少裂纹,且裂纹较为细小,宽
度为1~2 μm。轧制态钛合金中绝热剪切带的分叉现象与其组织
不均匀性和高密度位错相关。在轧制态钛合金中,由于组织的不均匀性,在绝热剪切区域微
观组织的演化过程中必然导致变形不协调。另外,高
密度位错对绝热剪切带的扩展起阻碍作用。因此,为
了协调变形以及减小扩展过程中的阻碍,绝热剪切带
即会发生分叉。同时,轧制态钛合金的组织在动态
压缩过程中易于引起变形不协调,产生应力集中,并
诱使裂纹的萌生和扩展,因此,轧制态钛合金中的裂
纹数量较多且有互相连接的趋势。
![]()
图7 热处理态钛合金中的绝热剪切带
文献3(2020):Multi-scale crystal plasticity finite element simulations of the microstructural
evolution and formation mechanism of adiabatic shear bands in dual-phase Ti20C alloy under
complex dynamic loading(复合动态载荷作用下双相Ti20C合金绝热剪切带的微观组织演化及形成机理的多尺度晶体塑性有限元模拟)
The microstructure inside the ASB is characterized by means of TEM (see Fig. 7(a) for the
obtained image). Micro regions consisting of multi-phase and multi-grain regions with large
residual stresses occur in the ASB. Details of the grain orientation and grain boundary are
captured accurately by means of PED (the measured grain orientation distribution is shown in
Fig. 7(b)). Using the soft-ware Image-Pro Plus V6.0 reveals that the shapes of grains inside the
ASB can be divided in two types: Type 1: elongated large grains with length of ∼4 nm (i.e., 2–5
times the grain width) along the ASB direction. The intragranular orientations are basically the
same; Type 2: small equiaxed grains (diameter: 500 nm).
![]()
Fig.7. Microstructure inside the ASB of TI20C: (a) TEM image and
diffraction pattern; (b) grain orientation distribution captured by means of PED.
The adiabatic shear deformation of the microcrystalline grains was investigated
by using the
crystal plastic finite element simulation method. Two α-phase grains (Gα1,
Gα2) and a β-phase
grain (Gβ1) are chosen as research objects. The elements at the centroids of the
grains are
referred to as Eα1, Eα2, and Eβ1, respectively. These elements
all undergo yielding, and the
effective stress decreases with continued deformation, indicating that stress softening has
occurred in these elements during the plastic deformation process. The softening effect is
strong in Eα1 and relatively weak in Eα2 and Eβ1. Therefore,
the stress of each element
decreases
quickly due to the effect of thermal softening, which may eventually lead to adiabatic shear
failure.
![]()
Fig.8. Simulation results of the micro model: (a) schematic showing the
positions of grains Gα1, Gα2, Gβ1, and the centroid elements
Eα1, Eα2,
Eβ1; (b) effective stress
historyof the centroid elements.
Multi-scale crystal plasticity finite element simulations of the microstructural evolution
and formation mechanism of adiabatic shear bands in dual-phase Ti20C alloy under complex
dynamic loading
Journal of Materials Science & Technology 59 (2020) 138–148
[ PDF
Document Download ]
文献4(2019):The failure mechanism at adiabatic shear bands of titanium alloy: High-precision
survey using precession electron diffraction and geometrically necessary dislocation density
calculation(钛合金绝热剪切带的失效机理:采用旋进电子衍射和几何必须位错密度计算的高精度测量)
The crystal orientation information of the failure position and surrounding region in ASB of a
Ti-5Al-2.5Cr-0.5Fe-4.5Mo-1Sn-2Zr-3Zn alloy was obtained via transmission electron microscopy
(TEM) and precession electron diffraction (PED) with a high spatial resolution. During dynamic
compression, ASBs eventually form at an angle of 45–55° to the loading direction and microcracks
nucleate, grow, and coalesce in these ASBs, leading to failure of the sample. This
microstructural evolution results in spatially heterogeneous microstructural characteristics of
the sample. Two ASBs occur at the edge of the specimen where crack coalescence is incomplete.
One of these denoted as ASB-1 contains part of the main crack of the specimen, where critical
failure is imminent, whereas the other denoted as ASB-2 is crack free.
![]()
Fig.3. Location and morphology of the ASB region.
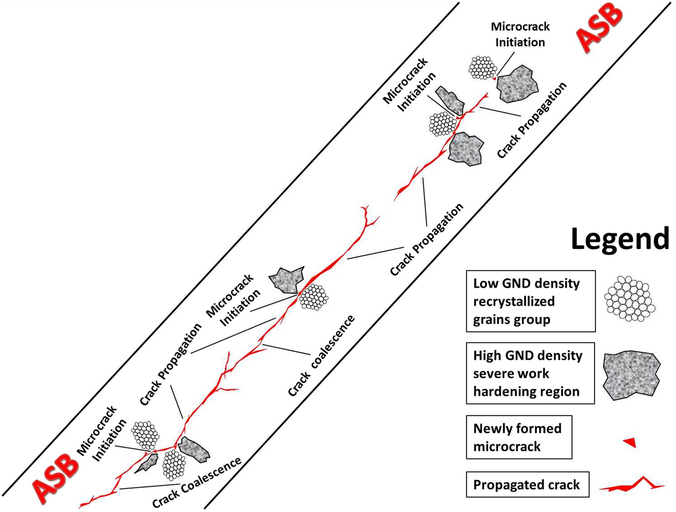
Considering the orientation, morphology, and GND density distribution, a new direct evidence for
revealing the underlying adiabatic shear failure mechanism is presented. As shown in Fig. 13,
microcrack initiation in ASB, owing to the incompatibility between the group of ultrafine
equiaxed recrystallized grains and the adjacent high work hardening region is assumed.
Microcracks occur in different regions of ASB, and then propagate and coalesce, resulting in the
failure of the material.
![]()
Fig.13. Schematic of the crack evolution in ASB.
The failure mechanism at adiabatic shear bands of titanium alloy: High-precision survey
using precession electron diffraction and geometrically necessary dislocation density
calculation
Materials Science & Engineering A 746 (2019) 322–331
[ PDF
Document Download ]
文献5(2019):Dynamic compression-induced twins and martensite and their combined effects on the
adiabatic shear behavior in a Ti-8.5Cr-1.5Sn alloy(动态压缩诱导孪晶和马氏体及其对Ti-8.5Cr-1.5Sn合金绝热剪切行为的综合影响)
The alloy can be roughly divided into three areas: far away from the center of the ASB (denoted
as I), close to the ASB (denoted as II), and inside the ASB (denoted as III). In area I, the
twins and martensite are evenly distributed in the alloy. In the image, the black region and the
gray region correspond to the strain-induced martensite and the β phase, respectively. The phase
boundary between the martensite and the matrix is relatively clear, and the dislocation density
around the boundary is high, indicative of dislocation accumulation near this boundary. The
underlying reason lies in the fact that the coordinated deformation between the two phases
induces a large stress at the phase interface, leading to an increase in the dislocation
density. In area II, i.e., close to the ASB, the plastic deformation becomes severe and
dislocation accumulation in both phases is intensified, thus leading to the microstructure
heavily deformed. In area III, the microstructure is mainly composed of the ultra-fine and
equiaxed grains (size: 200 nm). It is clearly seen that these small, equiaxed grains have
well-defined boundaries.
![]()
Fig.7. Typical area near the ASB of the alloy and the corresponding schematic:
(a) the area far away from the center of the ASB; (b) the area close to the ASB; (c) the area
inside the ASB.
Fig. 9 ① and ② show SEM images of the areas adjacent to the ASBs in the alloy, while Fig. 9 ③and
④ show regions that are relatively far from the ASBs. Many twins and a large amount of
martensite occur in the alloy, but the number of these structures is significantly lower near
the ASBs. During ASB initiation and formation, however, the twins and martensite in the vicinity
of the ASBs are refined, owing to dislocation motion and dynamic recrystallization, which will
absorb energy to some extent. Fig. 9 ① and ③ reveal the bifurcation of ASBs during the dynamic
loading process. In fact, the local stress at these locations and the structural fluctuation
increase, owing to the twins and martensite in the alloy, and ASB expansion is hindered by ASB
interaction with these locations. The expansion is also hindered by the twins and martensite
perpendicular to the shear direction, resulting in a bifurcation of the ASBs.
![]()
Fig.9. SEM images showing four typical regions of the alloy at a strain rate of
2000/s: ① and ③ show the areas adjacent to the ASBs; ② and ④ show the regions far from the ASBs.
Dynamic compression-induced twins and martensite and their combined effects on the adiabatic
shear behavior in a Ti-8.5Cr-1.5Sn alloy
Materials Science & Engineering A 759 (2019) 203–209
[ PDF
Document Download ]
文献6(2015):Underlying mechanism of periodical adiabatic shear bands generated in Ti–6Al–4V target
by projectile impact(弹体撞击Ti-6Al-4V靶板产生周期性绝热剪切带的潜在机理)

The ASBs are not found in Cratering Zone I and Back Spalling Zone III, but a number of ASBs are
clearly observed in Ductile Hole Enlargement Zone II. The ASBs distribute regularly with an
averaged spacing of 2.5–3 mm in the range of 8–25 mm along the penetration channel; the angle
between each ASB and the penetration direction is approximately 45°.
![]()
Fig.7. The microstructures of the cross-section of the target plate.
If the elements experience an identical effective stress, their strain failure criterion will be
determined by the hydrostatic pressure. The higher the hydrostatic pressure, the higher the
strain failure criterion, and severe plastic deformations or ASBs will be induced along the
penetration channel. Once the severely deformed element reaches the threshold strain, it will be
removed from the model, and the extremely high hydrostatic pressure is unloaded. Subsequently,
the hydrostatic pressure accumulates once again during the next interaction of the projectile
nose with the target material until the next strain peak reaches the failure criterion.
Therefore, such a periodic loading unloading cycle of the hydrostatic pressure in the target
constitutes the mechanical mechanism behind the development of multiple periodical ASBs.
![]()
Fig.8. Evolution for the three parameters of the target elements along the
central axis at corresponding penetration depth:(a)the plastic strain;(b)the effective
stress:(c)the hydrostatic pressure.
Underlying mechanism of periodical adiabatic shear bands generated in Ti–6Al–4V target
by projectile impact
Materials and Design 87 (2015) 231–237
[ PDF
Document Download ]
文献7(2013):Numerical Simulation in relation to Adiabatic Shearing Behaviors in Titanium
Alloy(钛合金绝热剪切行为的数值模拟)
Little change of the crack initiation time is found when the α phase proportion within the shear
band is varied from 60.6% to 14.3%, and the maximum difference is only 0.8μs, which indicates
that the phase proportion within the shear band has little influence on adiabatic shear
sensitivity for equiaxed titanium alloys. Therefore, itis not the key factor that dominates the
adiabatic shear sensitivity.
![]()
Figure.3. The equiaxed titanium alloys with different α phase proportions within
shear bands (a) (d), 14.3%; (b) (e), 22.5%; (c) (f), 60.6%.
As is seen in Figure 5, the strain localization region is readily observed in the direction of 45
°, leading to the formation of the adiabatic shear band. When the α phase proportion outside the
shear band is varied from 13.8%~46%, with the increase of the α phase proportion, the strain
localization region decreases. For the α phase proportion of 13.8%, it has the largest strain
localization region, the highest strain is more than 2.9, and the initiation of apparent cracks
are observed; however, when the α phase proportion increases to 46%, the highest strain is lower
than 0.7, and the strain localization region almost disappears. In order to further study the
phenomenon, influence of the α phase proportion outside the shear band on adiabatic shear
sensitivity is calculated. The results show that as the α phase proportion changes from 13.8% to
46%, the crack initiation time is varied from 40.1μs to 46.2μs, and the difference of crack
initiation time is up to 6.1μs, which indicates the α phase proportion outside the shear band is
the key factor that dominates the adiabatic shear sensitivity of equiaxed titanium alloys and
the adiabatic shear sensitivity decreases with increasing α phase proportion within a certain
proportion of α phase. The research further shows that since the α phase has a better uniform
plastic deformation ability than the β phase has, with the increase of the α phase proportion,
the uniform plastic deformation ability increases, resulting in a decreased tendency of strain
localization, thus the adiabatic shear sensitivity decreases.
![]()
Figure.5. The effective plastic strain contours with the calculation time is
44μs(a) 13.8%; (b) 20%; (c) 27%; (d) 34.7%; (e) 42%; (f) 46%.
Numerical Simulation in relation to Adiabatic Shearing Behaviors in Titanium Alloy
Journal of Physics: Conference Series 419 (2013) 012020
[ PDF
Document Download ]
文献8(2012):微观组织对Ti-6Al-4V-4Zr-1.5Mo 合金绝热剪切敏感性的影响(Effects of Microstructure on the Adiabatic Shear
Banding Sensitivity of Ti-6Al-4V-4Zr-Mo Alloy)
通过β退火得到的是纵横交错的网篮状组织,因此剪切带在扩展的过程中需要不断改变方向冲破更多的晶界的阻碍,同时在片状组织中运动方向的改变比在球状组织中更频繁,裂纹容易分叉形成次生裂纹,这些过程的结果使裂纹的总长度增加,
需要对更多的金属体积塑性变形做功,从而具有更高的断裂韧性。等轴α
相具有较强的抗裂纹萌生的能力,有利于钛合金塑性和冲击性能的提高,但由于其晶界较网篮组织少很多,裂纹比较容易扩展,因此其绝热剪切敏感性较网篮组织要高;从图5b
中可以看出,双态组织靠近剪切带的基体组织中出现了比较多的微裂纹,而其他两种组织中均未出现。这些微裂纹的存在为剪切带的扩展提供了更多的路径,使其更加容易扩展,同时这些微裂纹在应变不断增加的过程中不断长大,并相互连接,最终形成造成材料失效的宏观裂纹。通过图5d
可以观察到这些微裂纹绝大多数产生于α/β 相界处,这是由于晶界处α 相尤其是连续薄片状晶界α相的存在容易使应变被局限在软态的α 相内,从而导致了晶界处的裂纹形核和断裂。
![]()
图5 同一应变率下3种组织剪切带形貌
文献9(2010):TC4 合金绝热剪切动态演变过程数值模拟研究(Simulation of Adiabatic Shearing Behavior of TC4 Alloy during
Dynamic Loading)
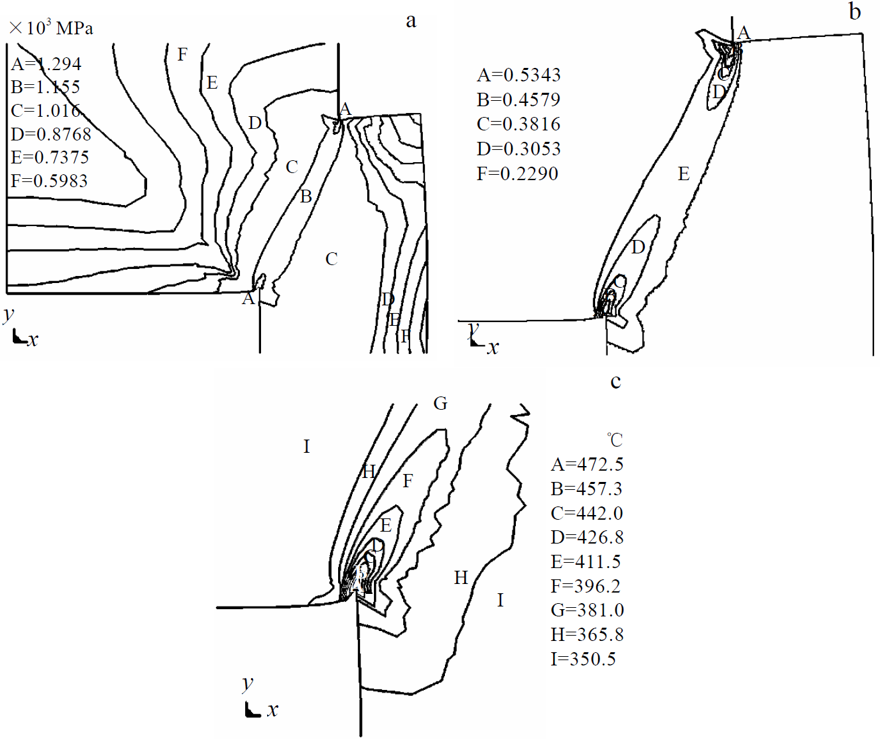
在强迫剪切条件下,帽形试样两拐角连线附近的区域为变形强烈的变形局域化区域,是帽形试样在承载过程中最易发生绝热剪切的部位;帽形试样两拐角处承受应力最大,变形最为严重,而且绝热温升最高,因此是绝热剪切带萌生的主要部位;两拐角连线附近的变形局域化区域内,温度较基体高,且温差较大,应力、应变集中,是绝热剪切带扩展的主要区域。
![]()
图2 LS-DYNA模拟结果
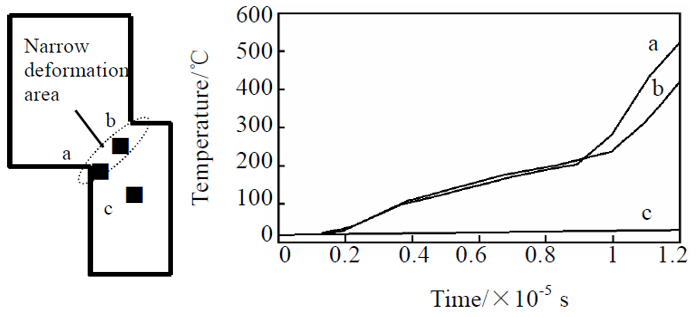
选取3
个特征部位(分别为帽形试样的下拐角处、变形局域区中心以及基体部位)研究其温度随时间变化的情况。从结果数据可以看出,随着变形的增加,变形局域化区域内温度在极短时间内迅速升高,而基体温度变化不大。拐角处最高温度达到525
℃,超过了TC4 合金的再结晶温度(0.4Tm, 约为 480 ℃),但未达到其相变温度(约 1000 ℃)。因此在本模型中,TC4 合金绝热剪切带内最高温度超过了TC4
的再结晶温度,为其微观组织发生动态再结晶提供了动力;由于带内最高温度远低于其相变温度,因此带内组织不可能发生相变。
![]()
图3 特征部位分布图及特征部位温度随时间变化曲线