文献1(2010):基于数字图像处理技术的等离子喷涂氧化锆涂层热导率影响因素有限元研究(Finite Element Study of Influence Factors on Thermal
Conductivity of Plasma Sprayed Zirconia Coatings Based on Digital Image Processing)
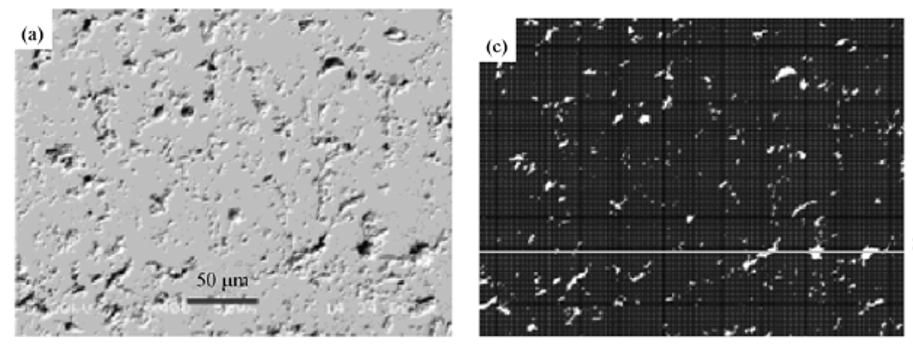
可通过灰度阈值分割技术识别涂层显微图像内部的陶瓷材料、孔洞及裂纹等。 灰度阈值分割是最常见的图像分割处理方法。图1(a)为氧化锆涂层SEM
照片,图中暗区代表了孔洞和裂纹,而亮区则表示陶瓷。将二元图像转化成矢量化的显微组织结构并导入有限元分析软件中,生成与涂层显微组织相一致的有限元模型,
如图1(c)所示,从而在氧化锆涂层隔热性能计算中考虑了材料的非均质性。
![]()
图1 涂层截面与有限元网格模型
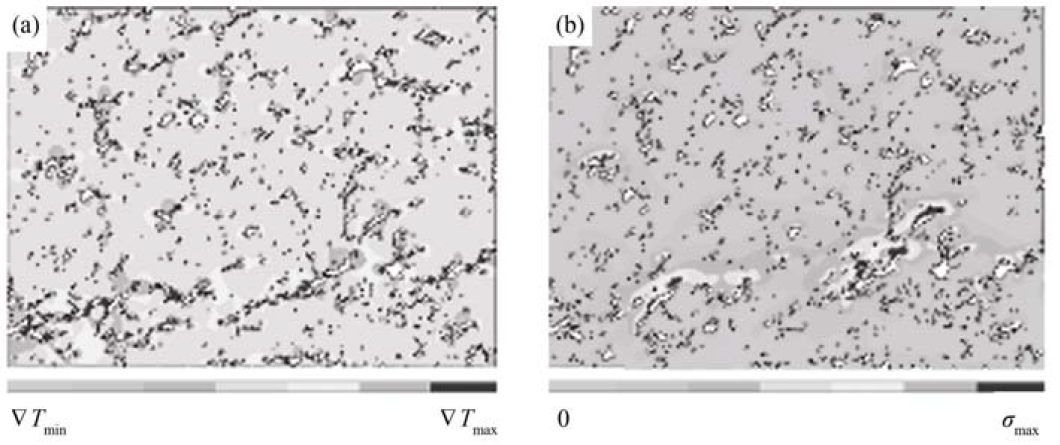
图2(a)为涂层的温度梯度▽T分布云图。缺陷的存在一方面改变了温度梯度在涂层中的分布,使得在缺陷的周围存在明显的温度梯度集中区,从而有效地降低了涂层的热导率;另一方面,高的温度梯度也会导致高的应力区域的出现,降低了涂层的力学性能。图2(b)为涂层中的最大主应力分布图,深色区域为应力集中区,是陶瓷层中最薄弱的部分,当应力积累到一定程度时,裂纹会由此迅速扩展,并最终导致涂层失效。
![]()
图2 涂层温度梯度(a)与第一主应力(b)分布图
文献2(2008): Three-Dimensional Simulation of Plasma Jet and Particle Groups in Plasma
Spraying(等离子体射流和等离子体喷涂中粒子群的三维模拟)
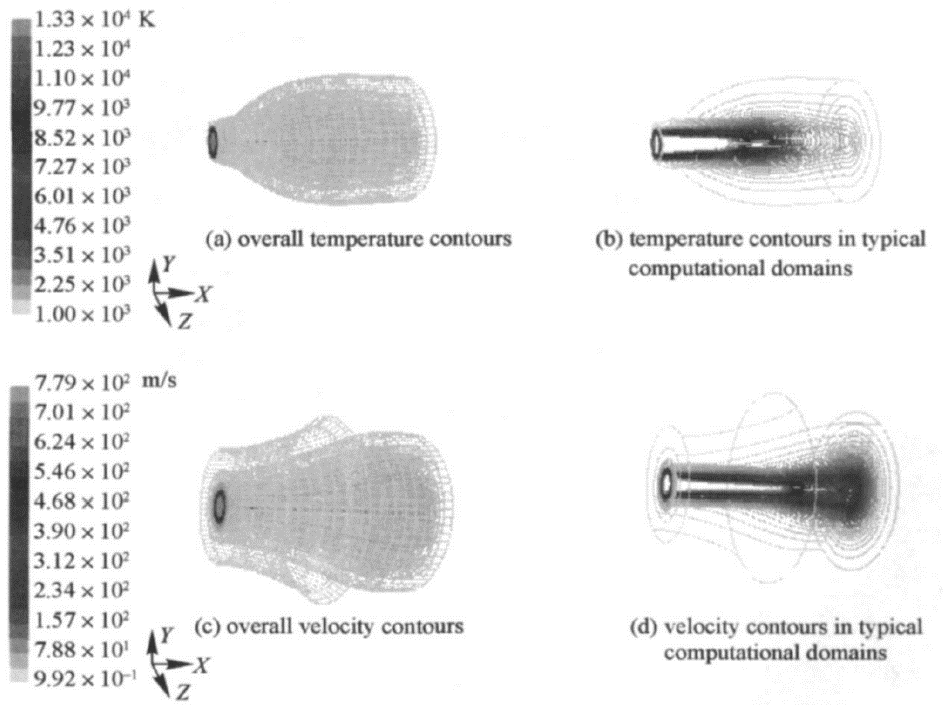
It can be seen from Fig .2 that the temperature and velocity at the plasma core don' t change
significantly, since the ambient air doesn’t penetrate into this zone .But at 80 mm away from
the nozzle exit, the corresponding temperature decreases to 1000 K, and the velocity decreases
to 260 m/s .At a certain axial distance, the temperature and velocity along the radial direct
ion also decrease due to strong heat and momentum transfer in plasma spraying .It might be noted
that while the air is entrained into the computational domain, the width of the plasma jet
becomes wider with the increase of the axial distance .
![]()
Fig.2. Three dimensional temperature field without substrate
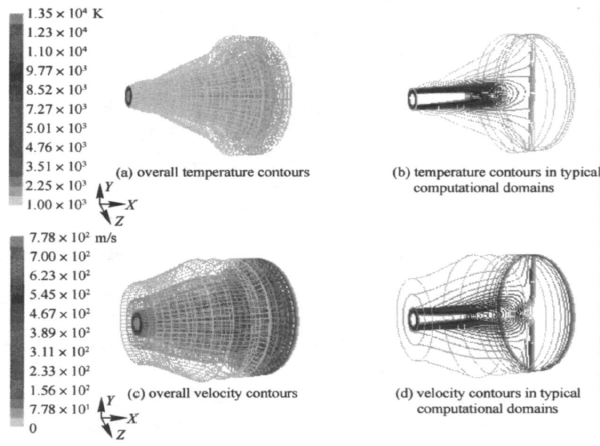
It can be seen from Fig .5 that if the substrate is considered in the numerical
simulation procedures, the plasma jet would interact with not only the ambient air but also the
substrate, ex changing heat and momentum .The plasma jet becomes more wider and appears to be a
“cone hat” due to the interaction between the plasma and the substrate . Under the predefined
boundary conditions, at 80 mm away from the nozzle exit, the corresponding temperature decreases
to 1000 K, while the velocity decreases sharply to 0 .At a certain axial distance, the
temperature and velocity values along the radial direct ion also decrease .The difference
resulted from the existence of the substrate will definitely affect the heating of the particles
and particle trajectories . However, at the plasma core or around this zone, there is not an
obvious difference. The temperature or the velocity even fit s a similar descending tendency at
the posit ion far from the substrate.
![]()
Fig.5 Three dimensional temperature field with substrate

Three-Dimensional Simulation of Plasma Jet and Particle Groups in Plasma Spraying
Journal of Beijing Institute of Technology (English Edition) 17(2008):115-121
[ PDF
Document Download
]
文献3(2008): Study of Flying Particles in Plasma Spraying(等离子喷涂中飞溅粒子的研究)
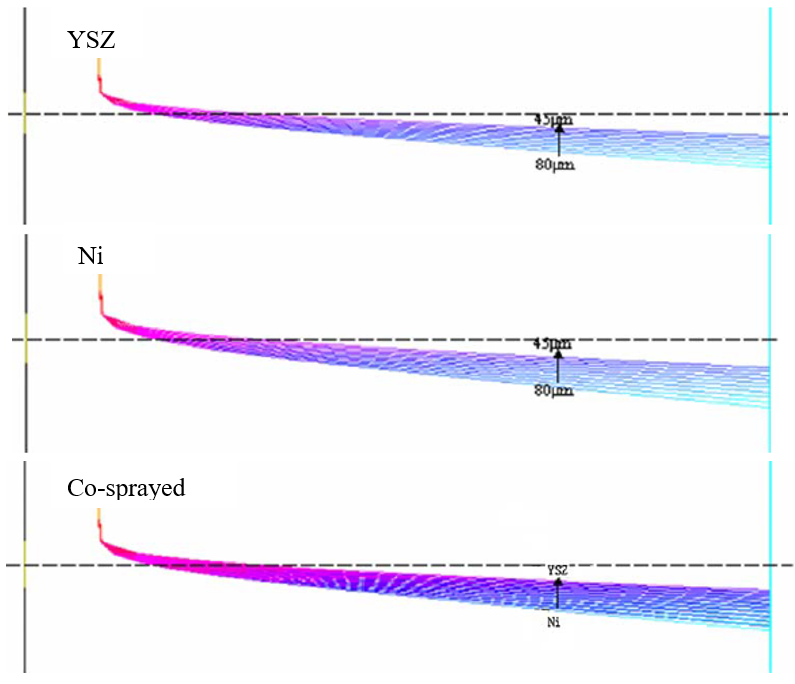
It can be seen that, flying particles trajectories in plasma spraying are dependent on the
particles material type, as well as diameter. For particles of a certain material sprayed
independently (see Fig. 4 and 5), particles with larger diameters penetrate more deeply into the
plasma jet in the radial direction; for particles of different materials sprayed simultaneously
(see Fig. 6), the particle groups will not overlap completely with each other. Since the density
of Ni is higher than that of YSZ, Ni particle group will penetrate more deeply than YSZ in the
radial direction. Therefore, particles density and diameter are the key factors that determine
if the particle can penetrate into the plasma core or the high temperature zone and be heated
sufficiently. Especially when spraying FGM, spray parameters shall be adjusted to ensure
particle groups of different materials can overlap in a large degree. For example, Ni particles
with larger density shall be selected as small-diameter ones. It might be noted, however, that
the diameters must not be too small, so as to inhibit oxidation or evaporation.
![]()
Fig.4 Trajectories of YSZ particles, Ni particles and co-sprayed particles with
different diameters
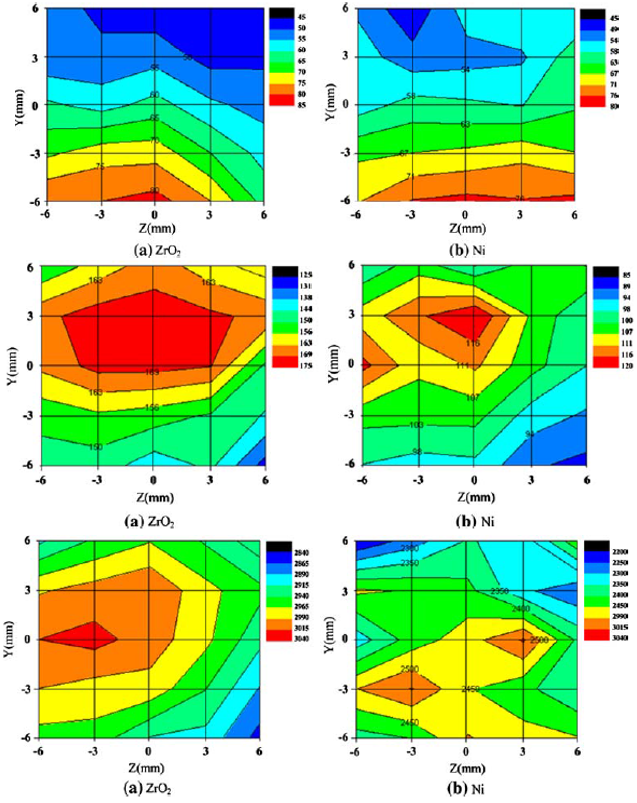
When a particle group is entrained into the plasma jet in the direction of -Y and reaches the
position x = 80 mm (normally the substrate position), particles with different diameters arrive
at different positions. For any material, particles of larger diameters always penetrate into
the plasma jet more deeply than those with smaller diameters. Therefore, along negative Y-axis
the particle diameter will increase. It’s shown that there is a specific correlation between
particle velocity and particle diameter in the same ZY plane, that is, particles with larger
diameter generally correspond to slower velocities. Usually, along negative Y-axis the particle
velocity will decrease。Particle temperature spatial distribution contour in the ZY plane
indicates that particles with highest temperature are not located in the place where smallest
particles are located, but nearly the center of the plasma jet (Y = 0).
![]()
Fig.7 Spatial distribution contour of Particle diameter, Particle velocity and
Particle temperature.
Study of Flying Particles in Plasma Spraying
Journal of Materials Engineering and Performance 17(2008)621–626
[ PDF
Document Download
]
文献4(2008): Modeling influence of basic operation parameters on plasma jet(基本操作参数对等离子体射流的影响)
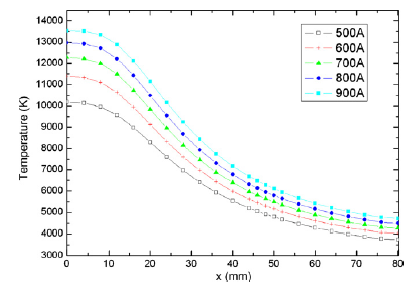
Fig.3 shows the temperature values along the axis under the serial of electrical currents. It
can be seen that, the temperature filed in the plasma jet greatly depends on the electrical
current. At the same position, the higher the electrical current I is, the higher the
temperature is, which is directly related to the input power. Since the input power is
proportional to the electrical current, increasing I will definitely increase the input power,
thus raising the temperature of the whole plasma jet. It can also be seen, however, with
increasing the axial distance, the temperature difference due to the different currents will
become weakened. The main reason for this is that these regions have been far from the
high-temperature and high-velocity jet core and the turbulent boundary layers.
![]()
Fig.3 Distributions of temperature along the axis: with increasing electrical
current, the temperature at the same positions will be increased.
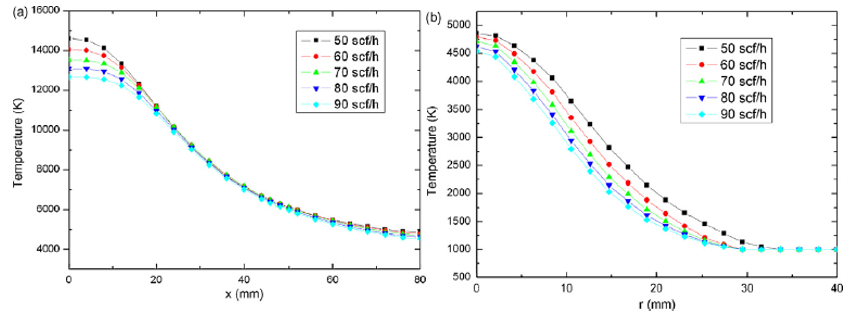
Fig.7(a) and (b) shows the temperature distributions along the axis and the radial position (x =
80mm) respectively under different Ar flowrates. As is presented in Fig. 7(a), near the region
of the plasma jet core, the higher the flow rate of Ar, lower the temperature is. But at the
regions far from the plasma jet core (x > 20 mm), such influence will become weakened. At
different radial positions (x = 80 mm), the temperature level has generally decreased. The
highest temperature decreases to 4858 K, as seen in Fig. 7(b). Fig. 7(b) also shows that a
higher primary gas flow rate causes a lower temperature at the same positions.
![]()
Fig.7 Distributions of temperature (a) along the axis (b) along the radial
position (x = 80mm) for different Ar flow rates: with increasing Ar flow rates, the temperature
at the same positions will be decreased
Modeling influence of basic operation parameters on plasma jet
Journal of Materials Processing Technology 198(2008):207-212
[ PDF
Document Download
]
文献5(2007):等离子喷涂过程中喷枪出口处基本参量的预测方法(Prediction Methods of Basic Parameters at the Nozzle Exit in
Plasma Spraying)
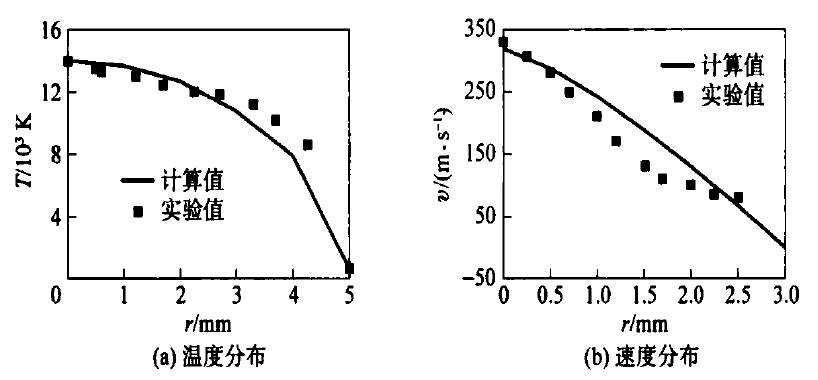
图5a 表示了I =500 A ,qAr =1.98 m3/h ,D =10 mm 工况条件下计算出的喷枪出口处的温度分布,并与Incropera
等人的实验结果进行了对比;图5b 表示了I
=196 A , U =30 V ,qAr =0.9 m3/h ,D =6 mm工况条件下计算出的喷枪出口处的速度分布,并与Boffa
等人的实验结果进行了对比。结果表明,计算值与实验值基本吻合,喷枪出口处速度与温度的分布均趋向于抛物线形式。
![]()
图5 典型工况条件下,喷枪出口的温度、速度分布
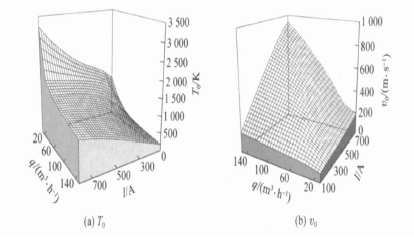
图7a 、图7b 分别表示了电流强度与气体流量对喷枪出口中心处温度T0和速度 v0的综合影响,图中氩气、氦气气体流量之比为4∶1。由图7a ,图7b
可见,当其他参量保持不变时,I与P
in成正比关系;随着I 的增加,T0及v0均增加,当I
保持不变时,随着单位时间内工质流量的增加,单位体积内参与化学反应以及受热升温的原子数目也随之增多,而总的输入功率增加不大.所以随着气体总流量的增加,T0降低,v0增加.在实际喷涂过程中,可利用类似图7
的模拟结果,根据需要的温度、速度来逆向选择和设置电流强度与气体流量,实现工艺优化,起到指导实际生产的作用。
![]()
图7 电流强度、气体流量对T0、v0的综合影响
文献6(2007): Modeling of composite coatings in plasma spraying(等离子喷涂复合涂层的建模)
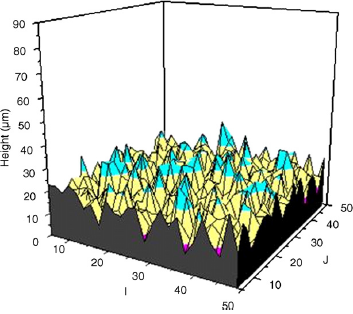
In Fig. 11, the original number of particles for both ZrO2 and Ni is 50, but the mass
fraction of
ZrO2 is 53.9% because its density is different from that of Ni. In addition, it shows
that the
composition of each coating is different, and the thickness of the 100% ZrO2 coating
(18.6 μm)
is relatively higher than that of the 100% Ni coating (15.1 μm), since the initial average
diameter of the ZrO2 droplet is slightly larger than that of the Ni droplet.
Therefore, with
increasing the ZrO2 composition for a ZrO2–Ni coating, the thickness of
the coating will
increase. In addition, Figs. how that the surface of the coating is rough, which is consistent
with the experimental results.
![]()
Fig.11. 3D morphology of 53.9% ZrO2 ceramic coating
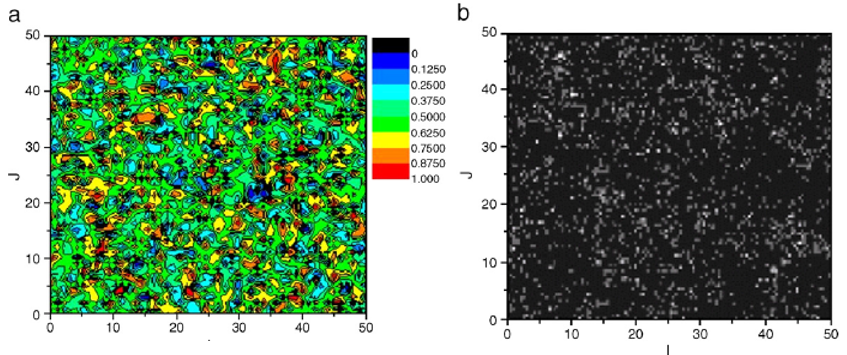
As presented in Figs. 14–16, the numerical simulation results are in good agreement with the
experimental results. The composition contours of each coating are different for different
ZrO2
mass fractions. The results show that even if in the same coating, the compositions in different
local areas are also different, but the composition of the same coating fluctuates near the
predefined value. Using the numerical analysis of the simulated results, it can be found that
the average ceramic composition at the centerline of the coating is 16.3%, 59.5% and 76.2%,
respectively, approaching the original mass fractions of ZrO2. Such results confirm
that the
methods proposed in this paper correctly describe the formation process of the composite
coatings
![]()
Fig.15. 2D composition contours of ZrO2–Ni coating with 53.9% ZrO2.
(a)
Simulated results; (b) SEM experimental result of Zr component contribution.
Modeling of composite coatings in plasma spraying
Surface & Coatings Technology 201 (2007) 6977–6984
[ PDF
Document Download
]
文献7(2007): Numerical simulation of temperature and velocity fields in plasma
spray(等离子体喷雾温度场和速度场的数值模拟)
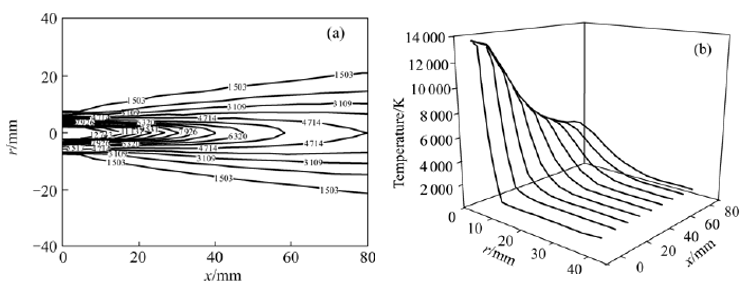
It can be seen from Fig.2 that when the high-temperature plasma jet diffuses into the atmosphere,
the temperature goes through a plateau near the nozzle exit (0−10 mm) with the value of 13534 K
at the very first stage, then decreases rapidly to about 4 000 K. The temperature contour
density in Fig.2 reflects the temperature changing rate: denser contours correspond to
relatively higher changing rate. Fig.2(a) shows that the temperature in the axial direction
changes slowly firstly, then sharply, and finally slowly again, which can also be seen from the
Temperature-x curve at the position of r=0. Fig.2(b) shows that given the same axial position,
temperature T in the radial direction also changes in three stages: slowly firstly, then
sharply, and finally slowly again. With the increase of the axial position, the changes will
become more and more slowly. In the outer region of the plasma jet, the temperature decreases to
less than 1 500 K. When the high-temperature jet diffuses into the room temperature atmosphere,
not only materials interchange but also heat interchange will happen. At the outer interface of
the turbulent plasma jet, the temperature decreases nearly to 1 500 K due to the atmosphere’s
cooling effects.
![]()
Fig.2 Temperature field under typical working conditions (a) Temperature
contours(K); (b) Temperature at different radial positions along axis
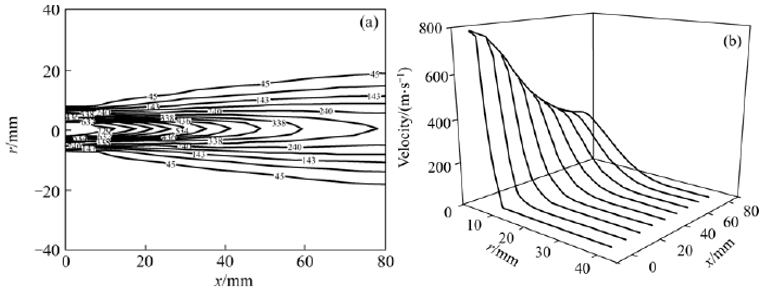
It can be seen from Fig.3 that when the high-velocity plasma jet diffuses into the atmosphere,
the velocity goes through a plateau near the nozzle exit (0−10 mm) with the value of 778.2 m/s
at the very first stage, then decreases rapidly to about 260 m/s. Similarly, the velocity
contour density in Fig.3 also reflects the velocity changing rate: denser contours correspond to
relatively higher changing rate. Fig.3(a) shows that the velocity in the axial direction changes
slowly firstly, then sharply, and finally slowly again by comparing the contour density along
the axis x, which can also be seen from the velocity-x curve at the position of r=0. Fig.3(b)
shows that, velocity at the same axial position in the radial direction also changes in three
stages: slowly firstly, then sharply, and finally slowly again. With the increase of the axial
position, the changes will become more and more slowly. In the outer region of the plasma jet,
the velocity decreases to less than 45 m/s due to the entrainment effect of the atmosphere on
the plasma jet. It might be noted that the axial velocities in some outer regions are negative,
indicating that the velocities are in direction x, which is just caused by the entrainment
effect.
![]()
Fig.3 Velocity field under typical working conditions (a) Velocity contours (m/s)
(b) Velocity at different radial positions along axis
Numerical simulation of temperature and velocity fields in plasma spray
Journal of Central South University of Technology 14(2007)496–499
[ PDF
Document Download
]
文献8(2005):等离子喷涂过程中飞行颗粒熔化状态的数值仿真(Simulation of Melted State of Particles in Plasma Spray)
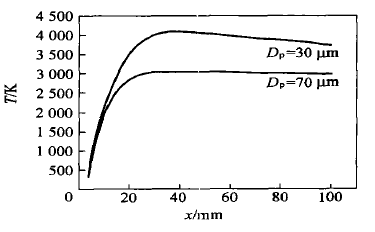
图3为2种颗粒的表面温度随轴向距离的变化情况,其进入射流场的初始温度均为300 K。由图3
可见,随着颗粒进入高温高速的射流场,其表面温度首先迅速攀升至一定值,之后随着轴向距离的增加,呈缓慢下降趋势;在相同轴向位置,直径较大的颗粒其表面温度也较低;在颗粒到达基体形成涂层位置时( x
=100 mm),直径为30 μm 的颗粒表面温度为3 730 K,高于其熔点温度2 983K,而直径为70 μm 的颗粒表面温度仅为2 990 K,仅略高于其熔点。
![]()
图3 2种不同直径ZrO2颗粒表面温度随轴向距离的变化
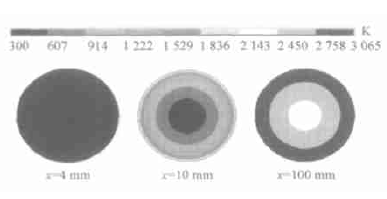
图5及其计算结果表明,当直径为70 μm的颗粒刚进入射流场时( x =4 mm) ,颗粒内部与表面温度相同,均为300 K ;当飞行至10
mm处,随着等离子体射流与颗粒热相互作用的进行,颗粒温度开始上升,但温度上升速度低于直径为30 μm的颗粒,表面温度达到了1 931 K,而中心温度仅为464
K;当到达基体位置处时,颗粒表面温度为2 992 K,略高于其熔点,而中心温度为2 332 K,低于熔点2 983 K,表明颗粒尚未完全熔化。
![]()
图5 飞行过程中ZrO2颗粒内部的熔化状态( Dp=70μm)
文献9(2004): 3D simulation of the plasma jet in thermal plasma spraying(热等离子体喷涂中等离子体喷射的三维模拟)
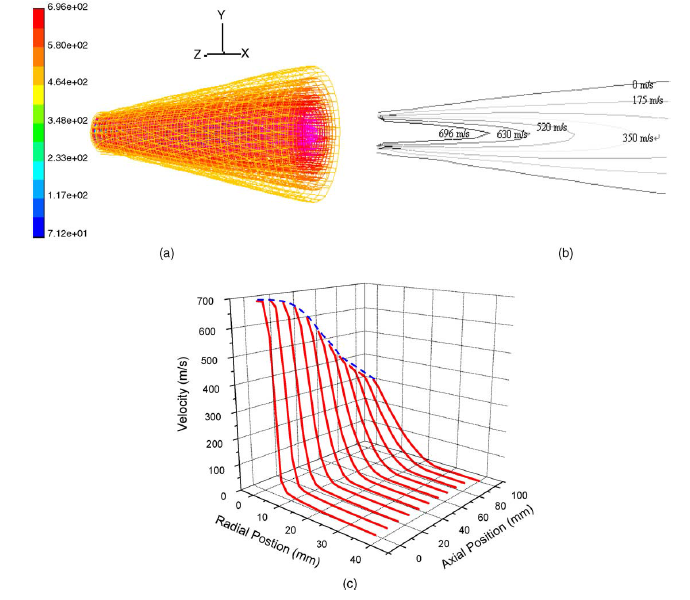
Fig.2(a) shows the 3D contours of velocity, which reflects explicitly the 3D appearance of the
plasma jet. Fig. 2(b) and (c) shows the 2D contours of velocity at the vertical section of the
computational domain and the 3D velocity continuous distribution along the radial and axial
positions, respectively. It can be seen that, at 100mm away from the nozzle exit, the
corresponding velocity decreases sharply to 300 m/s from the initial 692 m/s. At a certain axial
distance, the velocity magnitude along the radial direction also decreases. It might be noted
that the decrease rate of the velocity reduces with increasing axial distance. For example, at
the axial position of 0 mm, the velocity decreases sharply from 692 to 10 m/s when the radial
distance extends outward to 15 mm; however, at the axial position of 100mm and the radial
position of 23 mm, the velocity only decreases to 17 m/s, which is relatively slower. In
addition, while the air is entrained into the computational domain, the width of the plasma jet
becomes wider with increasing the axial distance as shown in Fig. 2(a) and (b). What is more,
the undisturbed zone which keeps the initial velocity dwindles (see Fig. 2(c)) and disappears at
some distance.
![]()
Fig.2. Velocity distribution in the plasma field: (a) 3D contours of velocity;
(b) 2D contours of velocity at the vertical section; (c) 3D velocity continuous distribution
along the radial and axial position
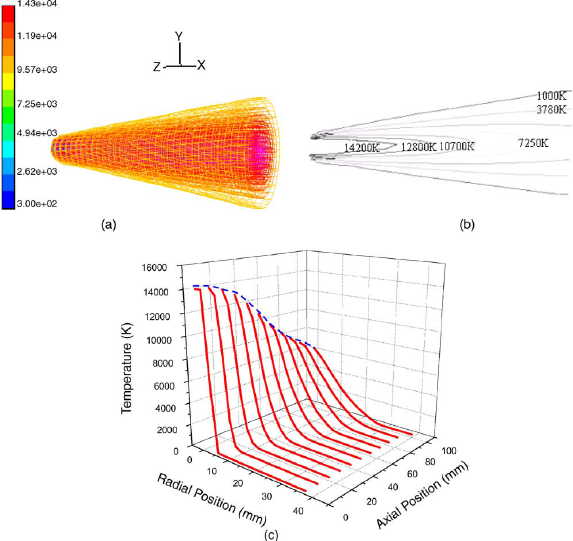
Fig. 3(a) illustrates the 3D contours of temperature, which also shows the 3D appearance of the
plasma jet like Fig. 2(a). Fig. 3(b) and (c) shows the 2D contours of temperature at the
vertical section of the computational domain and the 3D temperature continuous distribution
along the radial and axial position, respectively. It can be seen that, at 100mm away from the
nozzle exit, the corresponding temperature decreases sharply to 6600K from the initial 14,200 K.
And at a fixed axial distance, the temperature value along the radial direction also decays, as
seen in Fig. 2(c). It should be mentioned, however, the decay rate descends with increasing
axial distance. For example, at the axial position of 0 mm, the temperature decreases sharply
from 14,200 to 300K when the radial distance extends outward to 8 mm; while at the axial
position of 100mm and the radial position of 25 mm, the temperature falls relatively slower only
to 600 K. As the high temperature jet is injected into the air and expands violently, heat
transfer between the two is associated with mass exchange due to the temperature difference. At
the outer boundaries, the temperature of the jet decreases and the temperature of the air
increases. This means that, the plasma jet is cooled gradually by the ambient air.
![]()
Fig.3. Temperature distribution in the plasma field: (a) 3D contours of
temperature; (b) 2D contours of temperature at the vertical section; (c) 3D temperature
continuous distribution along the radial and axial position
3D simulation of the plasma jet in thermal plasma spraying
Journal of Central South University of Technology 14(2007)496–499
[ PDF
Document Download
]