文献1(2019):Simulation of failure processes of as-cast Ti-5Al-5Nb-1Mo-1V-1Fe titanium alloy
subjected to quasi-static uniaxial tensile testing(铸造Ti-5Al-5Nb-1Mo-1V-1Fe钛合金准静态单轴拉伸试验失效过程的模拟)
In general, the simulated results were in good agreement with the experimental results. the
simulated effective stress nephograms at the macro true-strains of 0.005 and 0.007 represent the
stress distribution of the model in the elastic phase; the nephogram at the macro true-strain of
0.009 represents the stress distribution in the yield phase; the nephogram at the macro
true-strain of 0.036 represents the stress distribution in the strain-hardening phase; and the
nephograms at the macro true-strains of 0.062 and 0.066 represent the stress distribution in the
fracture phase. Clearly, the effective stress of the model gradually increased along with the
strain until the fracture, at which point the effective stress of the model was released
rapidly.
![]()
Fig.7. Experimental and simulated true stress–strain curves
To quantitatively measure the topography of the fracture surface, we characterized the morphology
in the micro-region of 110 μm× 80 μm with a Micro XAM-100 Optical Surface Profiler at a
magnification of 3000×.We found that the height difference between the lowest point and the
highest point was 47.09 μm. Fig. 8(b) illustrates the fracture morphology of the FE model, and
the predicted topography of the fracture surface is rendered by the z-axis coordinate nephogram.
Similar to the experimental observations, the predicted height difference was approximately 50
μm between the lowest point and the highest point. Moreover, the simulated terrain trend was
also consistent with the experimental results, which showed an inclination of nearly 45°.
![]()
Fig.8. Fracture morphology (a) experimentally measured results (3000×); (b)
simulated results

Simulation of failure processes of as-cast Ti-5Al-5Nb-1Mo-1V-1Fe titanium alloy subjected to
quasi-static uniaxial tensile testing
Materials and Design 180 (2019) 107962
[ PDF
Document Download ]
文献2(2017):Three-dimensional microstructure-based micromechanical modeling for TC6 titanium
alloy(基于三维微观组织的TC6钛合金微观力学建模)
A DE-MicroCT SkyScan 1172 (Bruker microCT, Kontich, Belgium) was used to enhance the absorption
contrast between the constituent phases. This enhancement was performed by scanning the specimen
twice with different Xray filters and applied tube voltages. High-contrast low-noise micro-CT
slices of the annealed microstructure were obtained after reconstruction and enhancement of the
absorption contrast between each constituent phase; this enhancement was performed by using a
dual-energy Micro-CT imaging program (Dehist; Bruker microCT). 120 slices were selected in the
z-axis direction (through trans-axial direction), whereas a 60 μm ×60 μm region was selected in
the xy plane (frame-selected area). These slices were then imported into the Simpleware
(Simpleware Ltd., Exeter, UK) software to obtain the 3D microstructure of each constituent phase
of the alloy.
![]()
Fig.1. 3D microstructural model reconstruction for the TC6 titanium alloy: (a)
SEM image of annealed microstructure of the TC6 titanium alloy; (b) Diagram showing selection of
the volume of interest in Micro-CT slices; (c) 3D microstructure model of the alloy.
Numerical simulations are performed by using an Ansys/LS-Dyna code to model the micromechanical
response of TC6 titanium alloy subjected to uniaxial tensile loading at a constant strain rate
of 1.0×10⁻⁵s-1. The simulated true stress-strain response concurs with the
experimentally
determined response, which illustrates the current model just considering isotropic bilinear
constitutive law is acceptable. The entire elastic plastic deformation process can be divided
into four stages, based on the stress concentration among the constituent phases in the alloy.
These stages are the: (I) first stress concentration (εt≤0.007) in the primary α phase, (II)
stress concentration in the secondary α phase (0.007 < εt ≤0.009), ( III) stress
concentration
in the β phase (0.009≤εt ≤0.010), and (IV) second stress concentration in the
primary α
phase (0.010 < εt ≤0.05).
![]()
Fig.4. Finite element analysis based on a 3D microstructure model of TC6
titanium alloy subjected to uniaxial tension loading: (a) 3D microstructure finite
element model of the TC6 titanium alloy; (b) Numerical and experimental true
stress-strain responses obtained under tensile loading, and effective stress contours at
points A (εt =0.007), B (εt=0.0088), C (εt =0.010), and
D(εt =0.050).
Three-dimensional microstructure-based micromechanical modeling for
TC6 titanium alloy
Materials Science & Engineering A 685 (2017) 327–331
[ PDF
Document
Download ]
文献3(2017):SiC/Al 双连通复合装甲材料抗侵彻性能宏–微观跨尺度模拟(Multi-scale Simulation of Interpenetrating SiC/Al
Composite Armor Materials Subjected to Impact Loading Using a Macro-micro Approach)
利用Micro-CT(Sky- Scan1172)首先对3 mm×3 mm×3 mm SiC 多孔陶瓷预制体进行三维断层扫描与重构,之后通过反填充技术在孔隙位置构建Al
相的三维结构。利用NRecon 软件对不同角度获得的一系列投影图进行选区和重构处理, 获得尺寸为660 μm×660 μm 共300 层的一系列断层图片;利用CTan
软件对断层图片进行二值化处理,之后将二值化处理后的图片导入到Simpleware 软件内获得SiC 陶瓷预制体微结构三维模型,利用反填充技术获得金属Al
相的微观结构三维模型及复合材料模型;最后利用Simpleware 软件的Scan+FE 模块进行基于体素的网格剖分操作,获得具有纯六面体网格的SiC/Al
双连通复合装甲材料三维微观组织结构有限元模型
![]()
图2 SiC 多孔陶瓷预制体样品CT 扫描及重构过程和基于Simpleware 生成SiC/Al 双连通复合装甲材料三维微观组织模型构建过程
主裂纹形成过程:当t=4.0 μs 时,裂纹继续在界面处扩展并开始向陶瓷内部扩展,扩展方向大致与轴向平行;当t=6.0 μs 时,离散分布的裂纹之间开始产生桥连;t=6.5 μs
时,形成了贯穿整个模型的两个轴向主裂纹。随后,在主裂纹部分产生更多的分支裂纹,在t=8.5 μs 时最终交织成网状;裂纹萌生过程:在t=4.5 μs 时,界面靠近陶瓷相一侧开始产生裂纹,随后,
裂纹绕界面扩展并在陶瓷相内部产生新的垂直于轴向的水平裂纹,当t=7.0 μs 时模型内部产生多处离散分布的界面裂纹和陶瓷相内部的水平裂纹; 锥形主裂纹形成过程:当t=7.5 μs
时,在陶瓷相内部产生更多的离散分布的水平裂纹;当t=8.0~9.0 μs
时,界面裂纹开始向陶瓷相内部扩展并与水平裂纹搭接,扩展方向与轴向夹角呈45°,两界面处的裂纹开始桥连,桥连方向为45°方向,当t 达到11.0 μs 时形成两条锥形主裂纹。
![]()
图11 轴向主裂纹的形成过程和裂纹绕界面的扩展过程和锥状裂纹的形成过程
文献4(2016):Elastic plastic deformation of TC6 titanium alloy analyzed by in-situ synchrotron
based X-ray diffraction and microstructure based finite element
modeling(TC6钛合金的弹塑性变形的原位同步加速器X射线衍射分析和基于微观结构的有限元建模)
Elastic plastic finite element analysis is performed based on realistic SEM microstructure. By
converting the image to a gray scale digital image composed of pixels, one phase can be
extracted from the other by selecting a thresholding gray scale value. Similarly, based on the
same principle, metallographic analysis software can identify the volume fraction (V) of
each
phase: V(α) ≈ 80% and V(β) ≈ 20%. With one pixel corresponding to one finite
element, a
collection of pixels can be transferred to a collection of finite elements. In this way, a
finite element grid model (143 mm×162 mm) containing 234,325 4-node square elements (455 pixels
× 515 pixels)
![]()
Fig 4.(a)Microstructure of TC6 obtained by SEM:(b)the corresponding finite
element grid model.
Fig. 11 shows the contours of the Von Mises effective stress and plastic strain at point D (
εT=0.05). The stress in the β phase (~1150 MPa) is much higher than the stress in the
α phase
(~1000 MPa) (Fig.11(a)). However, the plastic strain in the α phase is still larger than that in
the β phase. The local amplifications show the strong plastic strain concentration in the α
phase near phase boundaries, which makes the α phase local strain remain larger than the applied
macroscopic strain. Accordingly, the stress along the current local path of the α phase
maintains a relatively steady extending trend comparing with the constitutive relation. From the
simulation, we know that strain concentration initiates from several points and then extends to
interior regions gradually.
![]()
Fig. 11. Contours of (a)the Von Mises effective stress and(b)plastic strain at
point D (εT=0.05)
Elastic plastic deformation of TC6 titanium alloy analyzed by in-situ synchrotron based X-ray
diffraction and microstructure based finite element modeling
Journal of Alloys and Compounds 688 (2016) 787-795
[ PDF
Document Download ]
文献5(2016):Reconstruction and quantitative characterization of the three dimensional
microstructure model of TC6 titanium alloy based on dual-energy X-ray microtomography
(基于双能X射线微断层摄影的TC6钛合金三维微结构模型的重建与定量表征)
Considering the efficiency of the following data processing, the volume-of-interest(VOI)of the
Micro-CT slices was selected initially. As is shown in Fig. 11,a total of 380 slices were
selected in the z-axis direction, whereas a region of 228 um ×228 um was selected in the xy
plane. Then these VOI Micro-CT slices were imported into CTAn to perform image processing.
![]()
Fig.11. Schematic of selecting the interesting volume in Micro-CT slices.
The Micro-CT slices processed by dual-energy imaging were imported into the Simpleware to
reconstruct the 3D microstructure of each constituent phase in TC6 titanium alloy. The size of
the 3D microstructure model is 120× 100 × 100 μm. To analyze the 3D microstructure
characteristics of TC6 titanium alloy at a finer scale, one eighth of the model was selected and
the 3D models of primary and secondary α phases as well as β phase were displayed independently.
The primary α phase is composed of discrete equiaxial grains and interconnected grains;the
secondary α phase and β phases form a completely interconnected network in 3D space. The reason
for the 3D microstructure of the secondary a phase appearing as an interconnected network
instead of a lamellar structure is related to the heat treatment process of TC6 titanium alloy.
The specimen was achieved by annealing at 800℃ for 2 h followed by air cooling. During the
holding stage, the secondary alpha phase dissolves, and nucleates back at grain boundaries or
inside the β grains during air-cooling down to the room temperature from β+α region, and
interconnects with the retained β phase forming a completely interconnected network.
![]()
Fig.14. 3D microstructure model of each constituent phase in TC6 titanium alloy
Reconstruction and quantitative characterization of the three dimensional microstructure
model of TC6 titanium alloy based on dual-energy X-ray microtomography
Materials Science&Engineering A 675 (2016) 212–220
[ PDF
Document Download ]
文献6(2015):Experimental Study and Numerical Simulation of the Tensile Test for GH4169 Coated with
YSZ Coating at High Temperature(YSZ涂层的GH4169合金高温拉伸试验研究与数值模拟)
At time t=120s from initial application of the load, stress concentration mainly occurred in the
YSZ ceramic top coating where the maximum tensile stress reached about 200 MPa. The maximum
principal stress vectors at this moment show the presence of an axial stress of typical elements
parallel to the loading direction, which is equally distributed through the thickness.
Simultaneously, coating material was subjected to a radial stress (the intermediate principal
stress which was much lower), which increased toward the interface between YSZ and bond coating,
where the failure of coating was more liable to occur. As the applied load continued to
increase, at t=180s, the maximum tensile stress eventually exceeded the tensile strength of YSZ,
triggering severe debonding failure in the center region of the specimen.
![]()
Fig.5 The initial debonding failure of YSZ coating: (a) stress contours of the
model at t=120s; (b) the maximum principal stress vectors inserted in Fig.5(a); (c) the
intermediate principal stress vectors inserted in Fig.5(a); (d) coating delamination in the
center region of the specimen
Fig. 7(a) shows the stress contours at t=780s, where it is seen that the residual coating can
apparently change the stress distribution inside the metal substrate. The tensile stress of
substrate with coating was nearly 40% lower than that without coating. Therefore, it can be
concluded that YSZ coating can relieve stress significantly, thus helping prolong the
substrate's service life in the same environment. As we can see from Fig. 7(b), residual YSZ
coating near the interface was subjected to a vertical or oblique tensile stress, which induces
further interfacial debonding failure, shown in Fig. 7(c). With the increase of external
loading, at t=900s, only a few residues can be seen at the arc transitional region (Fig. 7(d)).
![]()
Fig.7 The final debonding failure of YSZ coating: (a) stress contours of the
model at t=780s; (b) the maximum principal stress vectors inserted in Fig.7(a); (c) the
interfacial debonding failure of the residual coating; (d) residues at the arc transitional
region
Experimental Study and Numerical Simulation of the Tensile Test for GH4169 Coated with YSZ
Coating at High Temperature
Applied Mechanics & Materials 782(2015)237-244.
[ PDF
Document Download ]
文献7(2014):Simulation of damage and failure processes of interpenetrating SiC/Al composites
subjected to dynamic compressive loading(动态压缩载荷作用下SiC / Al双连通复合材料损伤破坏过程仿真)
Fig. 2 shows the generated 3-D FEM model (0.5 × 0.5 × 0.5 mm3) of the SiC/Al
composite, as well
as the SiC skeleton and Al. Subsequently, these models were imported to the ScanFE module, 3-D
FE models with mixed tetrahedral/hexahedral meshes were generated. In addition, 20 iterations of
the anti-aliasing algorithm and two iterations of Laplacian smoothing were also employed to make
the interfaces between the SiC skeleton and the Al smooth. Fig. 3 shows the built 3-D FE model
(0.5 × 0.5 × 0.5 mm3) containing 323,908 tetrahedral elements and 80,977 hexahedral
ones. These
3-D FE models were then exported to the Ansys/LS-DYNA software for numerical analysis.
![]()
Fig.2. 3-D reconstruction of SiC/Al IPCs and 3-D FE model of SiC/Al IPCs
In the final stage of failure (4.0-5.0μs), as shown in Fig. 18, there is an extensive region of
collapse in the SiC phase, but the Al phase still retains a certain structural integrity. Fig.
19 shows the effective plain strain contours of the Al phase at different times. To observe the
plastic deformation of the Al phase in 3-D space, the SiC phase is hidden. As shown in Fig.
19(a), there exists clear plastic deformation in the local, relatively narrow, regions in the Al
phase at t = 4.0μs. At t = 5.0μs (see Fig. 19(b)), local necking and tearing
fractures tend to
be localized in those severely deformed regions.
![]()
Fig.19. The failure contours of the 3-D FE model at t=5.0μs and the
effective
plain strain contours of Al at different times
Simulation of damage and failure processes of interpenetrating SiC/Al composites subjected to
dynamic compressive loading
Acta Materialia 78 (2014) 190–202
[ PDF
Document Download ]
文献8(2010):基于涂层显微组织图片的拉伸实验有限元数值模拟(Finite Element Simulation of Virtual Tensile Experiment Based
on Microstructural Images of Coating)
通过扫描电子显微镜( SEM) 得到放大1 000倍的ZrO2 陶瓷层横截面局部位置的物理图像。首先将SEM图转换成灰度图像后,
通过设定合适的灰度阈值将灰度图像转换成二值图像;然后,根据不同的像素点灰度值对应着不同的材料组元,将像素点的集合转换成有限元网格单元的集合,获得网格单元数为240 ×180 的有限元模型。
![]()
图1 ZrO2陶瓷层横截面显微组织图像及有限元网格模型
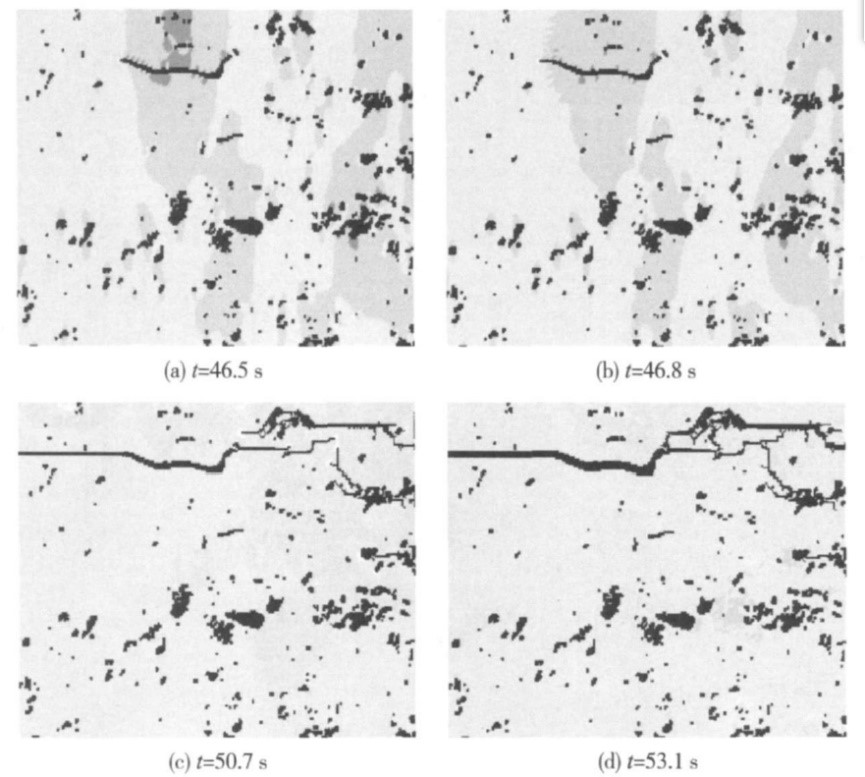
图5 为不同时刻的裂纹扩展图。t =46.8 s时,裂纹从A 点位置开始扩展,此时的拉应力载荷为78.0MPa;t =53.1
s时,横向裂纹贯穿整个模型,该区域内的涂层已被拉断,此时的拉应力载荷为88.5MPa。图6 表明,随着拉应力载荷不断增加,应力在裂纹尖端处迅速积累.当涂层内部应力达到失效应力时,首先从A
端点处裂纹开始迅速向左侧扩展;然后B 点和C 点处裂纹开始向右侧扩展,同时孔隙b
处裂纹开始向上纵向扩展;最终横向裂纹贯穿整个涂层,涂层被拉断裂纹的扩展方式以横向扩展为主,涂层最终断裂方式为层裂.裂纹扩展导致涂层失效的过程中,横向主裂纹α
起了主导作用,而纵向裂纹和孔洞的贡献很小。
![]()
图5 不同时刻裂纹扩展图
文献9(2009):基于显微组织图片的涂层热导率有限元计算研究(Finite Element simulation of Thermal conductivity Based on
Microstructural Images of Thermal Barrier Coatings)
先通过扫描电子显微镜(
SEM)得到ZrO2涂层横截面的局部位置放大物理图像文件,然后选取图像中某一特定区域,利用灰度阈值分割处理方法将整个图像分成2个部分,转化成一个二值图像。根据下面的算式,得到一个二值图像。随后根据不同的像素点灰度值对应着不同的材料组元,将像素点单元的集合转换成有限元网格单元的集合,建立得到网格单元数为125
×100的有限元网格模型,大小为125μm ×100μm。
![]()
图1 ZrO2涂层横截面显微组织图像、灰度分割二值图及有限元网格模型
ZrO2涂层稳态温度场分布如图4所示。图4表明,由于孔洞、裂纹的存在及其分布的不均匀性,导致了涂层稳态温度场的分布也极不均匀。尤其在孔洞、裂纹附近,温度梯度相对较大。孔洞、裂纹等缺陷的存在影响了涂层热量的传递。孔隙的存在降低了涂层的有效热导率;等离子喷涂ZrO2涂层中沿喷涂方向较垂直喷涂方向具有更低的热导率,低的热导率决定了ZrO2涂层沿喷涂方向具有更优的隔热性能。分析ZrO2涂层图片的显微组织结构,裂纹分布以横向为主。裂纹的横向分布阻碍了热流的纵向传播,从而降低了涂层的纵向热导率,提高了涂层的隔热性能。涂层热导率受孔隙率和孔隙形状共同影响。
![]()
图4 ZrO2涂层稳态温度场分布图
文献10(2009):Modeling of micro-crack growth during thermal shock based on microstructural images
of thermal barrier coatings(基于热障涂层微观结构图像的热冲击微裂纹扩展模拟)
A typical microstructure of plasma sprayed TBCs from the cross-section view by scanning electron
microscopy (SEM) is shown in Fig. 1. The model size is 240μm× 180μm. It includes YSZ TC and
NiCoCrAlY BC with the dark color indicating defects of voids and micro-cracks. Such an image can
be transferred to a digital image by digital image processing technology. A finite element grid
model based on the actual microstructure of TBCs is generated by thresholding
segmentation and finite element mesh generation principle. This finite element model is made up
of 180 135 finite elements, and the dimensions are 240μm× 180μm.
![]()
Fig.1. The cross-section microstructure and the finite element grid model of TBCs
After 25 thermal shock cycles, the micro-crack growth caused by high temperature gradient and
different CTE is shown in Fig. 3. Due to high temperature gradient and the existence of defects,
the tensile stresses in the horizontal direction are induced during thermal shock, so vertical
cracks initiated in the TC are developed, thus causing spallation of the TC finally. The
presence of vertical cracks can relieve residual stress, thus enhance TBCs thermal shock
resistance and prevent further delamination of TC. However, the large delamination crack in the
TC makes it transparent to oxygen, and hence the thermally grown oxide (TGO) is easily formed at
the interface of the TC and BC during high-temperature exposure. As shown in Figs. 3, a
comparison between experimental results and numerical results shows that after 25 thermal shock
cycles, the crack growth in simulation result agrees well with the corresponding experimental
result. The methodology in our present work is effective to model the micro-crack growth.
![]()
Fig.3. Simulation result and experimental result of micro-crack growth after 25
thermal shock cycles.
Modeling of micro-crack growth during thermal shock based on microstructural images of
thermal barrier coatings
Computational Materials Science 46 (2009) 600–602
[ PDF
Document Download
]