文献1(2020):Effect of trace carbon on the dynamic compressive properties in the as-cast
Ti13V11Cr3Al alloy(微量碳对铸态Ti13V11Cr3Al合金动态压缩性能的影响)
Fig. 3 shows the TEM-BF images and TEM-EDX results of the as-cast
Ti13V11Cr3Al titanium alloy. The TEM-BF images of the β-Ti matrix and
TiC precipitate are shown in Fig. 3(a) and (b), respectively. The selected
area electron diffraction (SAED) pattern (Fig. 3(a) inset) confirms the
body-centered-cubic structure of the β-Ti matrix. Compared with the
SEM image in Fig. 1, Fig. 3(b) reveals more detailed morphology, i.e.,
needle-like precipitates with aspect ratio »1. The chemical composition
of the precipitates is determined via TEM-EDX analysis of two typical positions (Fig. 3(b))
shown in Fig. 3 (c) and (d), respectively. Comparative
analysis indicates that the C/Ti atom ratio at position 1 (denoted as
the precipitate) is ~1, whereas a rather low C/Ti atom ratio occurs at
position 2 (denoted as the β-Ti matrix). Therefore, based on the effect of
inevitable deviation, the precipitate is determined to be TiC produced by
trace carbon. The electron diffraction spots shown in the inset of
Fig. 3(b) can further confirm the existence of the face-centered-cubic TiC
phase (JCPDS 659622). Furthermore, a small amount of twin structure
(indicated by blue lines in Fig. 3(b) inset) forms during the nucleation
and growth of TiC, as reported in previous studies.
![]()
Fig.3. TEM-BF images and TEM-EDX results of the as-cast Ti13V11Cr3Al titanium
alloy: (a) and (b) are TEM-BF images of the β-Ti matrix and TiC precipitate, the
corresponding SAED patterns are shown in the insets, (c) and (d) show the TEM-EDX results
obtained from two typical positions shown in (b).
Fig. 7 shows the true stress-logarithmic strain curves of the
Ti13V11Cr3Al titanium alloy at room temperature. As shown in Fig. 7
(a), similar experimental results are obtained for the three samples
subjected to quasi-static tensile load conditions. The ultimate tensile
strength (UTS) and ultimate elongation (UE) of 860 MPa and 10.4%–
12.2%, respectively, are estimated for the as-cast alloy. In addition,
considering the strain rate effect, the dynamic compression tests of the
as-cast alloy are conducted at various strain rates, as illustrated in Fig. 7
(b). At high strain rates, the true stress increases monotonically with
increasing the logarithmic strain in the elastic deformation stage. Subsequently,
the true stress starts to decrease slightly after reaching the
peak value, which is different from the quasi-static loading (see Fig. 7
(a)). Such softening behavior results from the low thermal conductivity
of titanium alloy. During the dynamic compression, the adiabatic
heating transformed by the plastic deformation is difficult to diffuse
away. This causes that the thermal softening induced by dislocation
annihilation counteracts to the strain hardening induced by dislocation
multiplication. In addition, the results suggest that the dynamic
compressive strengths of the as-cast alloy remain approximately the
same (i.e., 1350 MPa at 3445/s-4158/s). This is attributed to the dynamic equilibrium between
the strain rate hardening and the thermal
softening behavior. Catastrophic fracture failure occurs only when
the strain rate is further increased to 4158/s, i.e., the critical fracture
strain of the as-cast alloy is extremely sensitive to strain rates and can be
determined to be >35% at 4158/s. Compared with other titanium alloys
reported in previous studies, the as-cast Ti13V11Cr3Al alloy
exhibits excellent dynamic plasticity. Furthermore, Fig. 7(c) shows the
dynamic compression properties of the as-cast (red) and heat-treated
(blue) alloys at a strain rate of 4000/s. Both alloys exhibit a relatively
close dynamic compressive strength (~1350 MPa). The dynamic
ductility of the as-cast alloy (~0.35) is significantly greater than that of
the heat-treated alloy (~0.3).
![]()
Fig. 7. True stress-logarithmic strain curves of the Ti13V11Cr3Al titanium alloy
at room temperature: (a) quasi-static tensile, as-cast, (b) dynamic compression at
various strain rates, as-cast, (c) dynamic compression of the as-cast (red) and heat-treated
(blue) alloys at a strain rate of 4000/s.

Effect of trace carbon on the dynamic compressive properties in the as-cast Ti13V11Cr3Al
alloy
Intermetallics 123 (2020) 106818
[ PDF
Document Download ]
文献2(2020):Ti-4.5Mo-5.1Al-1.8Zr-1.1Sn-2.5Cr-2.9Zn 钛合金
的动态力学性能及失效研究(Dynamic Mechanical Properties and Failure of Ti-4.5Mo-5.1Al-1.8Zr-1.1Sn-2.5Cr-2.9Zn
Alloy)
图2 为轧制态及热处理态钛合金的微观形貌。如图2a 和图2c
所示,由于轧制变形在接近(α+β)两相区上部发生,因此,轧制态钛合金的组织由β相基体及“等轴+条状”非均匀分布的α相组成,其中,条状α 相平均宽度约为1.3 μm,等轴α 相平均尺寸约为1.7
μm,且α 相所占比例较小。如图2b 和图2d 所示,热处理态钛合金的组织分布均匀,条状α 相及等轴α相共存组织转化为等轴α 相组织,α 晶粒稍微长大,平均晶粒尺寸约为2 μm,组织中α
相所占比例较大。
![]()
图2 轧制态及热处理态钛合金的组织形貌
轧制态及热处理态钛合金的断口形貌如图8所示,均由被拉长的韧窝和平滑的剪切区域两部分构成,呈现出典型的绝热剪切断裂特性。断裂面上拉长的韧窝区和平滑的剪切区相间分布,但韧窝区和剪切区在轧制态及热处理态钛合金中所占面积不同,表明轧制态及热处理态钛合金的主要断裂机制不同。如图8a、图8b所示,除韧窝区域外,轧制态钛合金的断裂表面存在大量剪切变形区域,这是由变形过程中发生不均匀变形导致的。韧窝区域的韧窝平均尺寸较小,约为4μm,少数韧窝存在拉长的现象,因此,轧制态钛合金的断裂机制为韧性断裂+脆性断裂;如图8c、图8d
所示,热处理态钛合金的断裂表面主要由韧窝区构成,剪切变形区域面积较小。与轧制态钛合金相比,热处理钛合金中韧窝的平均尺寸明显较大,约为7μm,大部分韧窝均存在被拉长的现象,因此热处理态钛合金的断裂机制以韧性断裂为主。在变形过程中,热处理态钛合金中的韧窝被充分拉长,使热处理态钛合金发生断裂失效需要比轧制态钛合金更多的塑性变形能量,因而其临界断裂应变较大。
![]()
图8 轧制态及热处理态钛合金的断口形貌
文献3(2015):Validation of the Tabulated Johnson-Cook Model for a Dynamic Compression
Simulation(动态压缩模拟的Tabulated Johnson-Cook模型验证)
As shown in Fig.1, the two-dimensional axisymmetric finite element model is only composed of
specimen (Φ5×5) as well as parts of input bar and output bar, and the non-reflection boundary
condition was applied on both of the upper and bottom sides of the model to ensure that on which
the stress wave did not reflect. The model is subjected to uniaxial dynamic compression by
prescribing a velocity along the y-axis negative direction on the nodes of upper side as well as
a displacement constraint along y-axis direction on the nodes of the bottom side. The loading
curve is defined as follows: the velocity in the compression direction is increased linearly
from 0 to the peak velocity(Vpeak) which is given by Eq.1 within 5μs, and then kept constant
until t=75μs to ensure a constant strain rate of 4000/s, and finally decreased linearly to 0 at
t=80μs.
![]()
Fig.1. Two-dimensional axisymmetric finite element model for dynamic compression
process and the corresponding boundary and loading conditions.
Three Cases are taken into account: Case 1: 1000/s and 2000/s; Case 2: 1000/s and 5000/s; Case 3:
4000/s and 5000/s. As shown in Fig. 3, the macro stress versus macro strain curves obtained from
Case 1~3 are compared with the benchmark curve. It is evident that the macro stress versus macro
strain curve of Case 2 is closest to the benchmark curve, while Case 1 and Case 3 are relatively
far away from it, indicating that 1000/s and 5000/s correspond to a wider range strain rate are
preferable for simulation.There are also three Cases: Case 4: 300K and 473K; Case 5: 300K and
1073K; Case 6: 973K and 1073K. As illustrated in Fig. 3, the macro stress versus macro strain
curves obtained from Case 4~6 are compared with the benchmark curve. Obviously, all of the macro
stress versus macro strain curves of Case 4~6 has no decline stage, quite different from the
benchmark curve, indicating that only two curves from the six curves, even with a wider range
(Case 5), cannot reflect the thermal softening effect.
![]()
Fig.3. Effect of stress-strain curves at different strain rates and temperature
on the simulation results.
Validation of the Tabulated Johnson-Cook Model for a Dynamic Compression Simulation
Applied Mechanics and Materials 782(2015) 245-251
[ PDF
Document Download ]
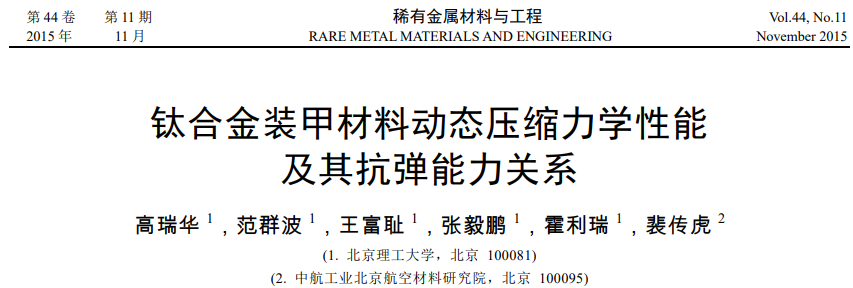
文献4(2015):钛合金装甲材料动态压缩力学性能及其抗弹能力关系(Relationship between Dynamic Compressive Mechanical
Propertiesand Ballistic Performance of Titanium Armor Materials)
经3000 s-1 的应变率压缩后,获得编号为TC61、TC62、TC3、A4251、A4252 的5种Φ5 mm×5 mm
回收试样的宏观照片。由宏观照片可知,在3000
s-1
应变率条件下,试样断裂失效方向沿着最大剪应力方向,即与圆柱试样轴线成45°方向,属于典型的剪切断裂。从各试样动态真应力-真应变(σ-ε)曲线图可以看出,动态真应力-真应变(σ-ε)曲线大致可分为弹性阶段和塑性阶段,没有出现明显的屈服平台。在屈服以后,随着塑性变形的增加,5
种试样的动态流变应力均无明显增加,说明这5 种试样在高应变率条件下的应变强化效应不明显。
![]()
图3 编号为TC61、TC62、A4251、A4252、TC3 试样变形断裂宏观图及动态真应力-应变(σ-ε)曲线
分析钛合金面板的正面及背面宏观损伤形貌发现,在7.62 mm 穿甲弹以740 m/s 的速度侵彻条件下,钛合金面板均被完全穿透。所有材料中,TC61
的钛合金靶板正面开坑较大,尺寸约为13mm×10
mm,出现崩落造成孔壁凹凸不平,未造成严重的冲塞破坏,同时背面没有翻唇现象,背凸不明显,这些现象均使得弹体侵彻靶板的过程中消耗更多的能量,利于靶板抗弹性能的提高。相比较而言,其它编号的钛合金正面开坑都没有TC61
明显,同时靶板背面都出现不同程度的背凸和翻唇现象,TC3 的翻唇现象表现得最为显著。TC3
靶板的孔壁光滑,为典型的绝热剪切冲塞破坏,装甲出现冲塞破坏现象时,装甲吸收弹丸的能量远低于塑性破坏吸收的能量,对弹丸的阻力大大减小,冲塞的形成往往意味着靶材防护性能的彻底丧失。因此,TC3
钛合金靶板的防护系数最小,其抗弹性能最差。
![]()
图4 钛合金靶板正面和背面的损伤情况
文献5(2015):一种新型近 β 钛合金Ti684 动态力学性能与抗弹性能的研究(Dynamic Mechanical Properties and Ballistic
Performance of a Newly Developed Near-β Titanium Alloy Ti684)
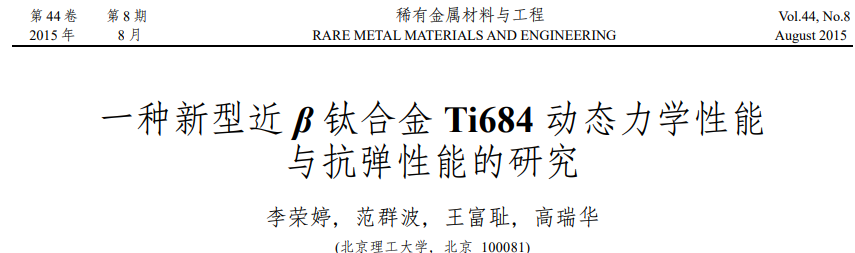
图3 为900 ℃/15 min/WQ Ti684 和 Ti-6Al-4V 试样的SEM 微观组织金相图。由于Ti684 试样的β
等轴状晶粒尺寸较大,为了能完整观察到晶粒晶界,Ti684试样微观组织标尺为100 μm, 从图3a 可看出Ti-6Al-4V 主要由片层状的初生α相和针状次生α相组成的近网篮组织构成;由图3b
可看出900 ℃/15min/WQ Ti684 试样微观组织主要由尺寸为150 μm 左右的等轴状β 相构成。图 4 为900 ℃/15 min/WQ Ti684
靶板弹坑截面处组织金相图。可以看出在β 等轴晶粒内有不同位向的针状马氏体,初步可以判断900 ℃/15 min/WQ Ti684靶板在抗冲击后产生了应力诱发马氏体α"。
![]()
图3 SEM 微观组织形貌和900 ℃/15 min/WQ Ti684 试样弹坑截面处组织金相组织
图6 为900 ℃/15 min/WQ 处理后的Ti684和Ti-6Al-4V 试样在应变率为2600 s-1 时的动态压缩应力应变曲线。从曲线可以看出,900 ℃/15
min/WQ处理的Ti684 动态强度为1870 MPa,断裂失效应变为0.2,Ti-6Al-4V 试样的动态强度为1370 MPa,断裂失效应变为0.16,900 ℃/15 min/WQ
处理后Ti684 动态强度和断裂失效应变分别高出试验用Ti-6Al-4V 约36%和25%,一方面是因为近β 型钛合金Ti684 具有较高的Mo
当量,[Mo]eq=10,较高的β
稳定元素形成的固溶强化效应;另一方面是因为900 ℃/15 min/WQ处理后的Ti684 合金在受高应变率冲击后,由于外界机械诱导使亚稳态β
转变为马氏体α",相变提高应变强化,放缓裂纹扩展和断裂,韧性通过这一机理大大提高。
![]()
图6 动态压缩试验的应力-应变曲线
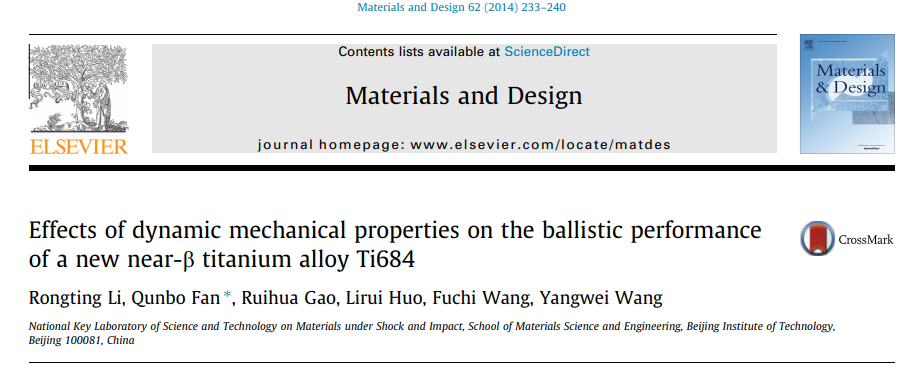
文献6(2014):Effects of dynamic mechanical properties on the ballistic performance of a new near-β
titanium alloy Ti684(动态力学性能对新型近β钛合金Ti684抗弹性能的影响)
The microstructures of the various Ti684 alloys and Ti–6Al–4V are shown in Fig. 5. The
microstructure of the sample prepared using the 900℃ WQ conditions (Fig. 5(a)) consists of
equiaxial β grains. The micrograph of the 900 ℃ WQ sample shows large grains, with an average
size of ~150μm. The microstructure of the Ti–6Al–4V sample (Fig. 5(d)) is near the basket wave
structure. The microstructures of the 760℃ solution treated and aged (STA) sample (Fig. 5(b))
consists of elongated primary α grains formed during the solution treatment, together with fine
secondary α grains formed during the aging treatment in the transformed β matrix. The
microstructure of the 800℃ solution treated and aged (STA) sample (Fig. 5(c)) is nearly the same
as the 760℃ STA.
![]()
Fig.5. Microstructure of Ti684 and Ti–6Al–4V plates in different conditions in
(a) 900℃ WQ, (b) 760℃ STA, (c) 800℃STA, (c1) primary a in 800℃ STA sample, (c2) primary α and
secondary α in 800℃ STA sample and (d) Ti–6Al–4V
Fig. 6 shows the dynamic true stress–strain curves of all the Ti684 alloy samples and Ti–6Al–4V
at a strain rate of 2605 s-1. Considering the saw tooth form of the curves, the
dynamic strength
is determined by the steady-state plastic flow stress, and the critical fracture strain is
determined by the intersection point between two tangent lines with regard to the plastic flow
stress and the collapsed-stage stress. As an example illustrated in Fig. 6, the critical
fracture strain of 900℃ WQ sample is 0.2. It can be seen that all the Ti684 samples have higher
dynamic strength than the Ti–6Al–4V sample supplied. This is a result of the solid solution
strengthening effect attributed to high content of the stable b phase elements in Ti684.The
dynamic yield strength of the 800℃ STA sample is 2400 MPa and the critical fracture strain is
0.1. The 760℃ STA condition has a lower dynamic yield strength than the 800℃STA, about 2200 MPa,
with a critical fracture strain of 0.156. This can be explained by the larger volume fractions
of fine secondary a in the 800℃STA sample. Finally, the 900℃WQ sample has a maximal critical
fracture strain of 0.20 and a dynamic yield strength of 1870 MPa.
![]()
Fig.6. Stress–strain curves obtained from the dynamic compression test of all
conditions.
Effects of dynamic mechanical properties on the ballistic performance of a new near-β
titanium alloy Ti684
Materials and Design 62 (2014) 233–240
[ PDF
Document Download ]
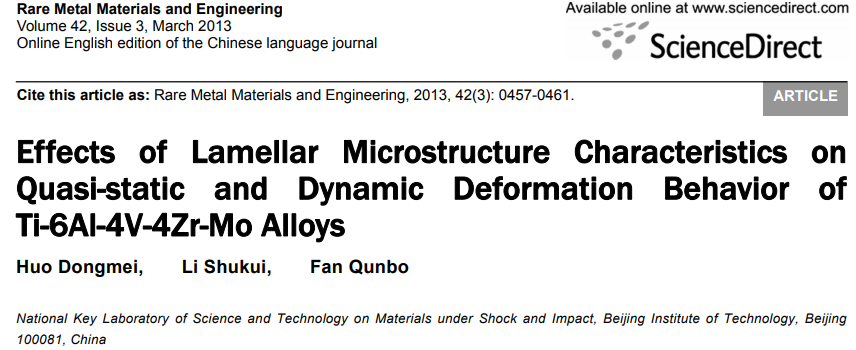
文献7(2013):Effects of Lamellar Microstructure Characteristics on Quasi-static and Dynamic
Deformation Behavior of Ti-6Al-4V-4Zr-Mo Alloys(层状组织特征对Ti-6Al-4V-4Zr-Mo合金准静态和动态变形行为的影响)
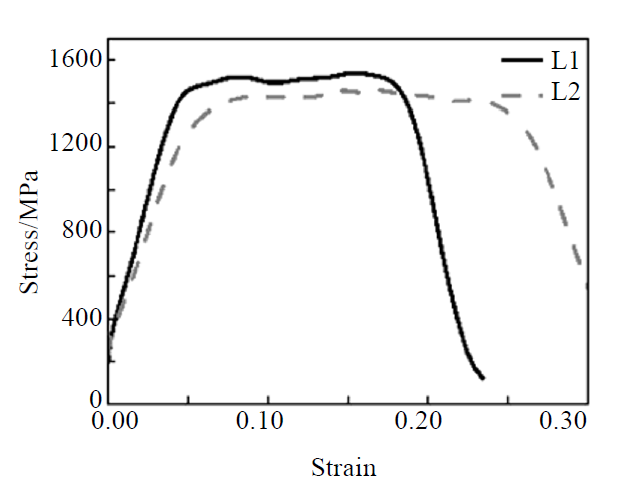
The true stress-strain curves of the Ti6441 alloys with different microstructure characteristics
are obtained from dynamic compression tests at the strain rate of 3000 s-1 (Fig.5).
It can be
seen from Fig.5 that the stress of the alloy with two different microstructures shows a similar
varied tendency, as the strain increases. The maximum stress point is reached immediately after
a little plastic deformation. After that, the flow stress roughly retains a certain value with
the increasing strain, due to the balance of strain, strain rate hardening and thermal softening
at the steady deformation stage. As the strain proceeds to increase, thermal softening, which
overrides strain rate hardening and strain hardening, is sufficient to induce plastic
instability and stress decreases sharply, resulting in the final adiabatic shear failure.
![]()
Fig.5. Stress-strain curves obtained from the dynamic compression tests.
SEM fractographies of the Ti6441 alloys with different detailed characteristics of lamellar
microstructures are shown in Fig.6. As presented in Fig.6a, the fractured compressed specimens
for both the L1 and L2 lamellar microstructures show a typical adiabatic shear fracture mode,
composed of relatively smooth shear regions and ductile dimples, but dimples are elongated in
the shear direction compared with those of quasi-static tensile fractured specimens. It can be
induced from the SEM image that the L2 microstructure show higher dynamic ductility than the L1,
due to the following reasons: (1) voids (Fig.6b) are observed within the shear region of the L2
microstructure, explaining an additional consumption of energy; (2) dimples in larger value of
size are presented within the L2 microstructure, as shown in Fig.6c and 6d.
![]()
Fig.6. SEM fractographs of the dynamically fractured specimens for both the L1
and
L2 lamellar microstructures: (a) the same macro-fracture, (b) the local magnified micrograph of
smooth shear region of L2; and the dimples within L1 (c) and L2 (d)
Effects of Lamellar Microstructure Characteristics on Quasi-static and Dynamic Deformation
Behavior of Ti-6Al-4V-4Zr-Mo Alloys
Rare Metal Materials & Engineering, 42(2013) 457-461
[ PDF
Document Download ]
文献8(2012): Numerical Simulation in relation to Adiabatic Shearing Behaviors in Titanium
Alloy(钛合金绝热剪切行为的数值模拟)
As is seen in Figure 5, the strain localization region is readily observed in the direction of 45
°, leading to the formation of the adiabatic shear band. When the α phase proportion outside the
shear band is varied from 13.8%~46%, with the increase of the α phase proportion, the strain
localization region decreases. For the α phase proportion of 13.8%, it has the largest strain
localization region, the highest strain is more than 2.9, and the initiation of apparent cracks
are observed; however, when the α phase proportion increases to 46%, the highest strain is lower
than 0.7, and the strain localization region almost disappears. In order to further study the
phenomenon, influence of the α phase proportion outside the shear band on adiabatic shear
sensitivity is calculated. The results show that as the α phase proportion changes from 13.8% to
46%, the crack initiation time is varied from 40.1μs to 46.2μs, and the difference of crack
initiation time is up to 6.1μs, which indicates the α phase proportion outside the shear band is
the key factor that dominates the adiabatic shear sensitivity of equiaxed titanium alloys and
the adiabatic shear sensitivity decreases with increasing α phase proportion within a certain
proportion of α phase. The research further shows that since the α phase has a better uniform
plastic deformation ability than the β phase has, with the increase of the α phase proportion,
the uniform plastic deformation ability increases, resulting in a decreased tendency of strain
localization, thus the adiabatic shear sensitivity decreases
![]()
Figure 5. The effective plastic strain contours with the calculation time is
44μs(a) 13.8%; (b) 20%; (c) 27%; (d) 34.7%; (e) 42%; (f) 46%
Numerical Simulation in relation to Adiabatic Shearing Behaviors in Titanium Alloy
Journal of Physics: Conference Series 419 (2013) 012020
[ PDF
Document Download ]