文献1(2020): Microstructure evolution and mechanical properties of a hot-rolled Ti
alloy(轧制态钛合金微观组织演化及力学性能)
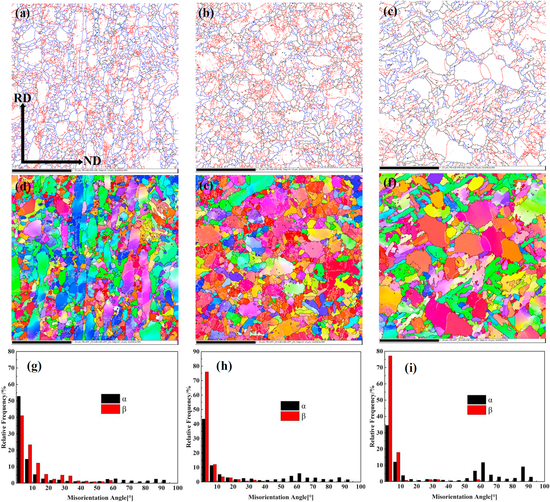
Based on the statistical data derived from Fig. 4(a), the misorientation
angle distribution of grain boundaries in the central region can
be obtained and is displayed in Fig. 4(g). The fraction of HAGBs in β
phase is 23.4%. Moreover, the fraction of HAGBs in α phase is 27.2%
and the transition from LAGBs to HAGBs is continuous. This indicates
that dynamic recovery occurs mainly in β phase. In addition, relatively
slight DRX also occurs in α phase. The misorientation angle distribution
of grain boundaries in the position of S = 0.4 is obtained and displayed
in Fig. 4(h) based on the statistically derived data from Fig.
4(b). The fraction of HAGBs in β phase is 8.4%, illustrating the occurrence
of more intense dynamic recovery in β phase compared with that
in the region of S = 0. Moreover, the fraction of HAGBs in α phase is
40% and the transition from LAGBs to HAGBs is continuous, indicating
the occurrence of more intense DRX in α phase compared with that in the region of S = 0. The
misorientation angle distribution of grain
boundaries in the position of S = 0.8 is displayed in Fig. 4(i) based
on the statistical data derived from Fig. 4(c). The fraction of HAGBs
in β phase is 3.9%, illustrating the occurrence of extremely intense dynamic
recovery in β phase. Moreover, the fraction of HAGBs in α phase
is 49.9% and the transition from LAGBs to HAGBs is continuous. This
indicates the occurrence of the most intense DRX in α phase compared
with that in regions of S = 0 and S = 0.4. In contrast, the level of DRX
in β phase in the region of S = 0.8 is the lowest among these specimens.
![]()
Fig. 4. EBSD grain boundary maps, grain boundaries in inverse pole figures and
corresponding misorientation distribution maps of the hot-rolled titanium alloy sheet: (a), (d),
(g)
S = 0;
(b), (e), (h) S = 0.4; (c), (f), (i) S = 0.8.
The microstructural orientation maps of α and β phases in the specimens
observed from the TD are shown in Fig. 5(a)-(f). The α and β
phases gradually concentrate on some orientations with the increase of
distance from the central region, such as the {0001} for the α phase and
{001} for the β phase.The pole figures of α and β phases in these specimens are shown in
Fig. 5(g) and (h), respectively. For α phase, the strongest texture locates
in the {0001} pole figure compared to that in the {01–10} pole figure
and the {-12-10} pole figure, as shown in Fig. 5(g). In the central region
(S = 0), the strength of the {0001}α texture is 6.99. With the increase
of distance from the central region, the strength of the {0001}α texture
increases to 11.29 (S = 0.4) and 20.70 (S = 0.8).
![]()
Fig. 5. Orientation maps of specimens: (a) α phase and (b) β phase of S = 0; (c)
α
phase and (d) β phase of S = 0.4; (e) α phase and (f) β phase of S = 0.8; (g) and (h) pole
figures
of α
phase and β phase in the hot-rolled titanium.
In the last stage of the hot rolling process, a great number of elongated
grains in all regions are fragmented into finer grains, especially in
the central region. Moreover, the grain fragmentation disturbs the preferred
orientation arrangement of grains concurrently, making the texture
strength of α and β phases in the central region lower than that
near the surface. At the same time, friction stress near the surface may
weaken the strength of some textures [28], such as the {101}β texture.
In addition, the level of the total DRX is higher than that near the surface
due to their more driving force of the total DRX in the central region.
What should be noticed emphatically here is that the DRX in α
phase exhibits an increasing trend with the increase of distance from the
central region, which is not consistent with the theoretical prediction
and contrary to that of the β phase, as shown in Fig. 8(d). This phenomenon
is attributed to the allocation of energy consisting of the accumulated
deformation energy and thermal energy during the hot rolling
process. With the increase of the distance from the center region, the
deformation energy descends down and the local temperature becomes
lower and lower gradually. Thus, the α→β phase transformation is inhibited,
making the fraction of α phase increase correspondingly. Simultaneously,
the driving force of DRX in α phase increases, strengthening
the DRX in α phase in the regions near the surface. Therefore, the fraction
of α phase and DRX in α phase exhibit an increasing trend with the
increase of the distance from the central region. Furthermore, with the
increase of distance from the central region, the driving force of DRX in
β phase decreases. Thus, the fraction of β phase and DRX in β phase exhibit
a decreasing trend.
![]()
Figure 8. Schematic of microstructural evolution along the thickness direction.
(a) Original microstructure of titanium alloy. (b) Hot-rolled microstructure showing different
deformation for the central region and the surface where dislocations appear. (c) DRX grains
appear in the central region. (d) Microstructure after hot rolling process showing different
grain
size and the level of DRX for the central region and the surface.

Microstructure evolution and mechanical properties of a hot-rolled Ti
alloy
Progress in Natural Science: Materials International xxx (xxxx) xxx-xxx
[ PDF
Document Download ]
文献2(2020):Effect of tungsten micro-scale dispersed particles on the
microstructure and mechanical properties of Ti-6Al-4V alloy(钨微尺度分散颗粒对Ti-6Al-4V合金组织和力学性能的影响)
The starting materials for mechanical milling were Ti-6Al-4V
powders with less than 150 μm in particle size (as shown in
Fig. 1(a)) and W powders with ~5 μm in particle size (as shown in
Fig. 1(b)). The chemical composition of the Ti-6Al-4V powders
was shown in Table 1. The two kinds of powders were mechanically
mixed at 250 rpm for 10 h using a SPEX 8000D high energy shaker
ball mill (SPEX 8000 mill/mixer, Nanjing University col., Ltd) to
avoid the agglomeration ofWpowders and obtain a homogeneous
composition during the sintering process. Stainless steel balls with
a diameter of 6 mmwere used to mix the powders and the ball-tocharge
ratio was 10:1. As a comparison, pure Ti-6Al-4V powders
were also prepared for reference under the same conditions. The
milled TC4 powders and TC4/W mixed powders were shown in
Fig. 1(c) and (d).
![]()
Fig. 1. The surface morphology of powders. (a) origin TC4 powders, (b)
originWpowders, (c) ball-milled TC4 powders, and (d) ball-milled TC4/W mixed powders. (e)
enlarge of (d).
Fig. 7 exhibits the fracture surfaces of TC4 and TC4-5%W alloys.
As shown in Fig. 7(a), it was found that the fracture surface of TC4
alloy mainly had a brittle cleavage fracture mode. The river patterns
were present in the fracture surface of TC4, which contained
numerous shallow and parallel tearing ridges. Moreover, A regions
(marked by red rectangular area) and B regions (marked by yellow
rectangular areas) showed the typical intergranular fracture characteristics,
which should be caused by the fracture of the continuous
αGB layers. Similar results have been reported by Berg et al. and Cao et al. Besides, therewere
still some dimples in the
fracture surface of TC4 alloy, but the number of these dimples was
very small and most of them were shallow, leading to a decrease of
ductility. On the contrary, Fig. 6(b) shows that the fracture surface
of TC4-5%W alloy has a ductile fracture mode, which reveals a large
number of dimples (marked by arrows). These dimples were
deeper than that of TC4 alloy, which also demonstrated that TC4-5%
W alloy possessed higher ductility, compared with TC4 alloy.
Meanwhile, it can be found that W particles (marked by black arrows
in Fig. 6(b) and the pink rectangular frame in Fig. 7(c)) were
pulled out of the tensile sample after the tensile test. The region
marked by the rectangular frame in Fig. 7(c) was detected by EDS,
which suggested that the particle pulled out from the TC4 matrix is
W particle. These W particles can effectively inhibit dislocation
movement during the tensile process, thus increasing the strength
of TC4-5%W alloy.
![]()
Fig. 7. Fracture surfaces of (a) TC4 and (b) TC4-5%W. The EDS regions of TC4-5%W
alloy (c) and the EDS mapping images of W particle and TC4 matrix (d).
Effect of tungsten micro-scale dispersed particles on the
microstructure and mechanical properties of Tie6Ale4V alloy
Journal of Alloys and Compounds 851 (2021) 156847
[ PDF
Document Download ]
文献3(2020):Effect of He content on microstructure, mechanical properties and He thermal
desorption behavior of W film fabricated by RF magnetron
sputtering(氦含量对射频磁控溅射制备的钨薄膜组织、力学性能和热解吸行为的影响)
Fig. 1 shows the effect of He atoms on the surface morphology of
W films. As shown in Fig. 1, the structure of both pure W films and
He-charged W films are very compacted. For W film deposited by
magnetron sputtering, there may be some nano-scale grains in
films, which can be hardly detected by SEM. Moreover, not all grain
boundaries in the deposited film can be easily shown in SEM images,
which may cause some the measurement errors. Therefore,
the SEM images can’t assess accurately the average grain size.
Nevertheless, the SEM images of surface morphology still can
indicate roughly that the grain size becomes smaller with
increasing He/Ar ratio. The trend of the change of grain size obtained
from the surface SEM images corresponds to the following
result of grain size calculated by the XRD peak profile analysis.
![]()
Fig. 1. The surface SEM images of W films deposited on the Si substrate at RT
under the different He/Ar ratios: (a) 0; (b) 1; (c) 2; (d) 3.
Fig. 6(a-c) shows the
distribution of He bubbles in W films fabricated at different He/Ar
ratios, and the mean diameter of these bubbles was estimated to be
about 1.0 nm. As Fig. 6(a) shown, a large number of He bubbles
distributed in the grain interiors and around the grain boundaries
(GBs) ofWfilms. In particular, the size of He bubbles trapped by GBs
was bigger than that located in grain interiors. Moreover, these He
bubbles around GBs were accumulated and connected to each
other to form a necklace-like line as shown in Fig. 6(a). The above
results indicate that the nucleation and growth of He bubbles are
preferential on the GBs for rapid diffusion than that in the grain
interiors, which had been found by J.H. Evans et al. and O. El-Atwani
et al. This is because a large number of vacancies exist on
the GBs so that more He atoms can be trapped by vacancies to form
bubbles at GBs. Meanwhile, it was easily found that the shape of He
bubbles in grain interiors was spherical and the shape of He bubbles
trapped by the GBs was ellipsoidal. For this difference of He
bubble shape, a similar phenomenon had been studied by A. Ofan
et al. In their work, they believed that the shape of He bubbles
is closely related to the surface free energy and the elastic free
energy. As a result, in our experiments, when the surface energy
was dominated, the spherical He bubbles in grain interiors were
formed. When the elastic energy played amajor role in this process,
elongated He bubbles along the grain boundary were formed. For
W films prepared at He/Ar=2 and He/Ar=3, He bubble size becomes
a little larger than before, but the mean diameter of these
bubbles was estimated to be still less than 2 nm, as shown in
Fig. 6(b) and (c).
![]()
Fig. 6. TEM images of W films fabricated at different He/Ar ratios: (a) He/Ar =
1; (b) He/Ar = 2; (c) He/Ar = 3.
Effect of He content on microstructure, mechanical properties and He thermal
desorption behavior of W film fabricated by RF magnetron
sputtering
Journal of Nuclear Materials 534 (2020) 152151
[ PDF
Document Download ]
文献4(2020):Study of high-speed-impact-induced conoidal fracture of Ti alloy layer in composite
armor plate composed of Ti- and Al-alloy layers(钛铝合金复合装甲板中钛合金层高速冲击诱导锥状断裂的研究)
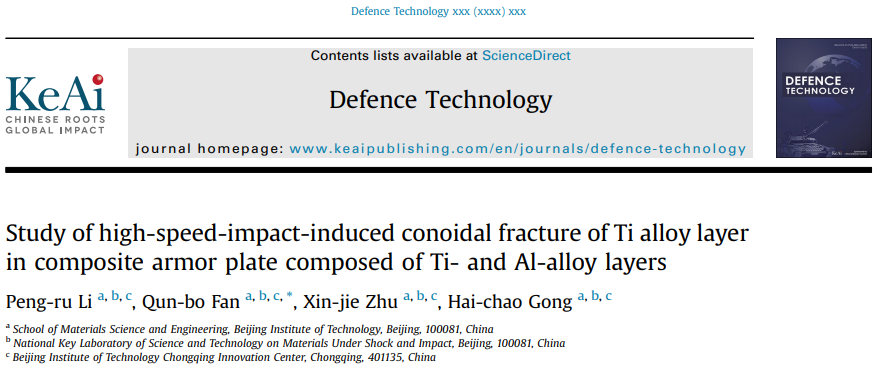
In Fig. 11(a), a scanning electron microscopy (SEM) image of
zone I is shown, and the morphological features of the scanning
area are shown in Fig. 11(b). The surface of the crack in the area
enclosed by red lines was rough and showed connected voids.
Further, another crack in the area enclosed by the blue lines had a
smooth surface and sharp tip, indicating that the shear crack
propagates as a result of shear deformation. Moreover, SEM
observation revealed that most of the cracks were accompanied by
adiabatic shear bands, thus indicating the main cause of the cracks.
Under the condition of loading at a high strain rate, the temperature
rise of the shear band was extremely high. Because of the
extremely uneven deformation in the band, many hot spots with
abnormal temperature existed. At some hot spots, microvoid
nucleation occurred under tensile or shear stress. As is shown in
Fig. 11(c), upon projectile impact under a high-strain-rate loading,voids nucleated at the
interface between the a phase and b phase in
the titanium alloy target plate.
![]()
Fig.11. Microscale morphologies in zone I: (a) SEM scanning area in zone I;
(b)microscale morphology at 200 × magnification; and (c) microscale morphology at 500 ×
magnification.
The microstructural characteristics in zone II are shown in
Fig. 14. The area enclosed by white lines in Fig. 14 (a) was observed
by SEM, and the morphological features of the area are shown in
Fig. 14 (b). A microcrack with a smooth surface and sharp tip was
located at the interface between the adiabatic shear band and the
matrix. Under the applied stress, the deformation of the matrix part
and the shear band was not synchronous, forming an elongated
microcrack. In the shear band, discontinuous voids connected to
the microcrack are visible. Fig. 14 (c) shows the voids in the matrix,
mainly in the sharp interface area between the α phase and β phase.
![]()
Fig. 14. Microscale morphologies in zone II: (a) SEM scanning area in zone II;
(b) microscale morphology at 200 × magnification; and (c) microscale morphology at
1500 × magnification.
Study of high-speed-impact-induced conoidal fracture of Ti alloy layer in composite armor
plate composed of Ti- and Al-alloy layers
Defence Technology, 2020.
[ PDF
Document Download ]
文献5(2020): Plastic deformation mode and α/β slip transfer of
Tie5Al-2.5Cr-0.5Fe-4.5Mo-1Sn-2Zr-3Zn titanium alloy at room
temperature(Tie5Al-2.5Cr-0.5Fe-4.5Mo-1Sn-2Zr-3Zn钛合金室温塑性变形形式和α/β滑移)
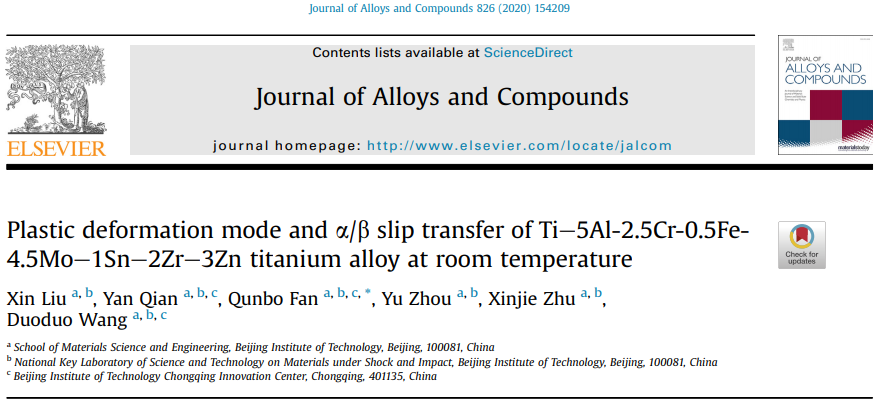
In the early stage of tensile deformation (Fig. 5a), the post-deformation morphology differed
only slightly from the pre-deformation morphology. However, the crystal orientation changed with
sub-grain boundary migration and substructure formation. The density of sub-grain boundaries
increased significantly as the deformation progressed (Fig. 5b). In the later stage of
deformation (Fig. 5c and d), the microstructure changed considerably (compared with the
microstructure in the early stage), owing to the generation and migration of new grain
boundaries and sub-grain boundaries.
![]()
Fig.5. OIM of the observed region with different strain.
Several features of slip activity and slip transfer could be summarized as follows: (1) Compared
with other slip systems, prismatic slip systems could be activated (e.g., by the slip transfer)
with a lower Schmid factor. (2) The crystal orientation changed during deformation, and adjacent
grains under coalescence or splitting adapted to the overall deformation. (3) Slip transfer was
partially blocked due to a large misorientation angle, and occurred with a very large
misorientation angle resulting from high Schmid factors for the incoming or outgoing slip.
![]()
Fig.11. Slip activation and slip transfer in a specific region: (a) 4% strain,
morphology and phase distribution, (b) 4% strain, Euler angle distribution, (c) 7.8% strain,
morphology and phase distribution, (d) 7.8% strain, Euler angle distribution.
Plastic deformation mode and α/β slip transfer of Tie5Al-2.5Cr-0.5Fe-4.5Mo-1Sn-2Zr-3Zn
titanium alloy at room temperature
Journal of Alloys and Compounds 826 (2020) 154209
[ PDF
Document Download ]
文献6(2020):In-situ investigation via high energy X-ray diffraction of stress-induced
(0002)α→(110)β transformation in a Ti-5.5Mo-7.2Al-4.5Zr-2.6Sn-2.1Cr
alloy(利用高能X射线衍射对Ti-5.5Mo-7.2Al-4.5Zr-2.6Sn-2.1Cr合金中应力诱导(0002)α→(110)β相变进行原位研究)
The equilibrium phase diagram of the Ti-5. 5Mo-7. 2A1-4.5Zr-26Sn-2.1Cr titanium alloy is
constructed using JMatPro software, as illustrated in Fig. 2(a). The amount of β-Ti will
increase monotonically with increasing temperature, whereas α-Ti disappears completely at a
temperature of ~895℃. Therefore, the β-transus temperature (Tβ)is ~895℃. The initial
scanning electron microscopy of the alloy in Fig. 2(b)reveals the bi-modal microstructure which
consists
of equiaxial primary α phase with a mean diameter of -3 μm and precipitated secondary α lamellae
(length:~3-4μm)in β matrix. Furthermore, the microstructure is accurately reproduced at the
center of the dog-bone-shaped specimen via EBSD. Fig. 2(c) shows the 400 x 400μm2
phase
distribution map, collected at a step size of 0.5μm. The volume fractions of the
hexagonal-close-packed α phase (red) and the body-centered-cubic β phase (blue) are 44% and 56%,
respectively.
![]()
Fig.2. Equilibrium phase diagram and initial microstructure of the heat-treated
Ti-5.5Mo-7.2Al-4.5Zr-2.6Sn-2.1Cr titanium alloy: (a) equilibrium phase diagram, constructed
using JMatPro software, (b) scanning electron microscopy morphology, (c) phase distribution map
obtained via EBSD.
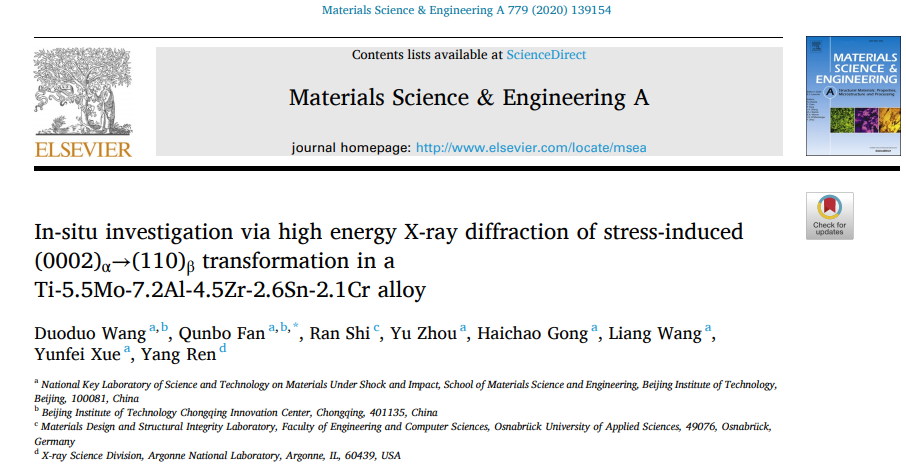
Fig. 11(a) shows a TEM-BF micrograph of the specimen subjected to 3% strain. In the early stage,
irreversible plastic deformation is retained in the form of dislocation lines at the grain
boundaries (indicated by the arrows in Fig. 11(a)). As the strain increases further to 5% (Fig.
11(b)), the multiplication of dislocations leads to an increase in the accumulated dislocation
density. Fig. 11(c) shows a high-magnification image of the region enclosed in the circle (see
Fig. 11(b)). A mass of dislocations accumulates in local regions, thereby resulting in
dislocation tangles, as indicated by the arrows in Fig. 11(c). Therefore, the interaction
between dislocations is considerable, and acts as an obstacle to further dislocation motion. The
strain hardening behavior at a strain of ~5% (Fig. 5 inset) confirms this hypothesis. A TEM-BF
micrograph obtained at 8% strain (Fig. 11(d)) shows that dislocation tangles are quite prominent
at this level of strain. Moreover, in the cellular dislocation structure (indicated by a red
dashed box in Fig. 11(d)), low-density dislocation regions are surrounded by cell walls with a
relatively high dislocation density. Fig. 11(e) shows a high-magnification image of the region
enclosed in the circle (see Fig. 11(d)). The dislocation tangles are gradually released and
cross-slipping occurs, as indicated by the arrows in Fig. 11(e). This results in dislocation
annihilation between opposite-type dislocations. The softening behavior induced by this
annihilation and the strain hardening behavior will reach a dynamic equilibrium, corresponding
to the steady-state flow stage in Fig. 5. In addition, the lack of a special BOR and stress
states between the (0002) and (110) reflections (see Fig. 10) may have prevented the
stress-induced (0002)α)→(110)β)transformation during the plastic
deformation stage.
![]()
Fig.11. TEM micrographs obtained at various strains: (a) BF image at 3% strain,
(b) BF image at 5% strain, (c) dislocation tangles, magnified view of the region enclosed in the
circle shown in (b), (d) BF image at 8% strain, (e) cross-slipping dislocation, magnified view
of the region enclosed in the circle shown in (d).
In-situ investigation via high energy X-ray diffraction of stress-induced (0002)α→(110)β
transformation in a Ti-5.5Mo-7.2Al-4.5Zr-2.6Sn-2.1Cr alloy
Materials Science & Engineering A 779 (2020) 139154
[ PDF
Document Download ]
文献7(2018):Correlation between dislocation-density-based strain hardening and microstructural
evolution in dual phase TC6 titanium alloy(双相TC6钛合金中基于位错密度的应变硬化与组织演化的关系)
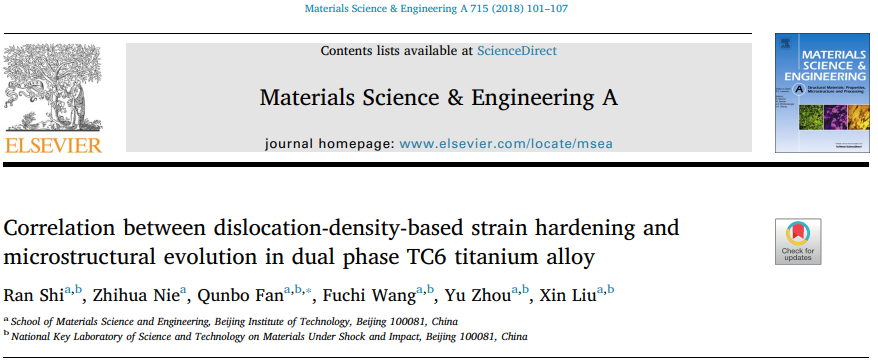
Fig.7 shows the dislocation microstructure at 1.5% strain. In this stage, irreversible plastic
deformation is stored in the form of dislocation tangles (indicated by the arrows in Fig. 7(a)).
Moreover, the strain-induced α-to-β phase transformation, described by the {11 2 0}α// {200}β
orientation relation (see Fig. 7(b)), occurs at this strain level. Plane A in the figure
corresponds to {11 2 0}α. From the
reciprocal diffraction spot, values of 2.083 Å and 1.466 Å
are calculated for the {110}β and {002}β planes, respectively. These
values are both lower than
the corresponding standard values (2.348 Å and 1.660 Å), indicating that the β phase is in the
compressive state.
![]()
Fig.7. TEM bright-field micrographs of the sample subjected to 1.5% strain, (a)
dislocation tangles, (b) strain-induced phase transformation from the α phase to the β phase.
With loading, interactions between dislocations increase leading to a mass of dislocation arrays
and cells. The cell wall has high dislocation density, and the cell interior is a low-density
dislocation region. An image of a typical dislocation microstructure at 2% strain is shown in
Fig. 8(a). As the figure shows, the dislocations of slip systems associated with a particular
direction in the α phase form numerous sub-grain boundaries. At 5% strain, slip systems
associated with another direction are activated, and the sub-grain boundaries (formed by
dislocations of the first direction) act as obstacles, as shown in nanopillar compression tests.
The interaction between slip systems associated with different directions leads to curved
dislocation lines and dislocation tangles (see Fig. 8(b)) and, in turn, strain hardening (see
Fig. 5). When the strain increases to 7%, the dislocation tangles are broken and shear banding
begins (as indicated by the engineering strain-stress curve in Fig. 1, after 7% strain,
significant softening occurs and the stress decreases). Dislocations on planes A {11 2 0}α
and B {1 21 0}α form a crisscrossing dislocation
pattern, as shown in Fig. 8(c).
![]()
Fig.8. TEM bright-field micrographs of samples subjected to: (a) 2% strain,
showing numerous sub-grain boundaries formed by dislocations, (b) 5% strain, showing curved and
tangled dislocation lines, (c) 7% strain, showing a crisscrossing dislocation pattern.
Correlation between dislocation-density-based strain hardening and microstructural evolution
in dual phase TC6 titanium alloy
Materials Science & Engineering A 715 (2018) 101–107
[ PDF
Document Download ]
文献8(2017):Three-dimensional microstructure-based micromechanical modeling for TC6 titanium
alloy(基于三维微观组织的TC6钛合金微观力学建模)
The commercial software Ansys/LS-Dyna was used to simulate the deformation process of
nanoindentation of a 10×10×5 μm3 (length×width×height) workpiece. A Berkovich
indenter was used;
this indenter has a triangular-based pyramid, which was modeled as an isotropic, purely elastic
solid with Poisson's ratio and Young's modulus of νi =0.07 and Ei =1100
GPa, respectively. In
addition, FEM was used to fit the experimental load-displacement data obtained from the
nanoindentation tests on the primary α phase in the TC6 titanium alloy. The constitutive
parameters were varied in order to match the simulated curves with the experimental ones. After
a parametric study consisting of 216 trials, we obtained a few bilinear constitutive law
parameters (135 GPa, 880 MPa, 6.5 GPa). As the figure shows, the simulation of the 500-nm-load
displacement curve, as well as the shape and size of the nanoindent are well-matched with the
experimental results.
![]()
Fig.3. Determining the constitutive relations of the primary α phase: (a) 3D
nanoindentation model setup and (b) comparison of numerical and experimental P-h curves as well
as the shape and size of the nanoindent in the primary α phase of the TC6 titanium alloy.
Numerical simulations are performed by using an Ansys/LS-Dyna code to model the micromechanical
response of TC6 titanium alloy subjected to uniaxial tensile loading at a constant strain rate
of 1.0×10⁻⁵s-1. The simulated true stress-strain response concurs with the
experimentally
determined response, which illustrates the current model just considering isotropic bilinear
constitutive law is acceptable. The entire elastic plastic deformation process can be divided
into four stages, based on the stress concentration among the constituent phases in the alloy.
These stages are the: (I) first stress concentration (εt≤0.007) in the primary α phase, (II)
stress concentration in the secondary α phase (0.007 < εt ≤0.009), ( III) stress concentration
in the β phase (0.009≤εt ≤0.010), and (IV) second stress concentration in the primary α
phase (0.010 < εt ≤0.05).
![]()
Fig.4. Finite element analysis based on a 3D microstructure model of TC6
titanium alloy subjected to uniaxial tension loading: (a) 3D microstructure finite
element model of the TC6 titanium alloy; (b) Numerical and experimental true
stress-strain responses obtained under tensile loading, and effective stress contours at
points A (εt =0.007), B (εt=0.0088), C (εt =0.010), and D(εt =0.050).
Three-dimensional microstructure-based micromechanical modeling for TC6 titanium
alloy
Materials Science & Engineering A 685 (2017) 327–331
[ PDF
Document
Download ]
文献9(2016):Elastic plastic deformation of TC6 titanium alloy analyzed by in-situ synchrotron
based X-ray diffraction and microstructure based finite element
modeling(TC6钛合金的弹塑性变形的原位同步加速器X射线衍射分析和基于微观结构的有限元建模)
The plastic strain and Von Mises effective stress contours at A, B and C are shown in picture.
Point A (εT =0.005) was chosen to be in the elastic deformation stage, and the plastic strain of
the whole area remains at zero until plastic deformation begins in the α phase at B (
εT
=0.0075). When the β phase also deforms plastically, C ( εT = 0.01) is the end point
of the
elastic to plastic stage. Point D ( εT = 0.05) is at the end of the simulation.
![]()
Fig.6. The plastic strain and Von Mises effective stress contours at points A (
εT = 0.005), B ( εT = 0.0075), and C ( εT = 0.01).
Comparing effective strain rates of three positions in the α grain along the selected path from A
position near the phase boundary to the grain center (positions 1, 2,3). During elastic
deformation, the effective strain rate of position 1 is ~2.5 ×10⁻⁵ s-1,
and ~2.35 ×
10-5 s-1 for
positions 2 and 3. Position 1 has a relatively higher strain rate, so the strain leads that of
other positions and the stress is more inclined to congregate near the phase boundary. Position
1 then enters primarily into the plastic deformation stage, and the strain rate increases to 3.2
× 10-5 s-1. Subsequently, stress release starts when positions 2 and 3
reach their critical
yield stresses and also enter plastic deformation. The strain rates of positions 1 and 2 are
influenced not only by the nearby β phase but also the stress transfer from the grain center
position, which make them drop sharply with different levels. From their distances to grain
center, the strain rates drop to 0.97 × 10⁻⁵ s-1 and 2.6 × 10⁻⁵
s-1,
respectively. Therefore,
the significant strain rate gradient inside α grain is the cause of the stress gradient. During
plastic deformation, the effective strain rate evolutions of these positions first converge then
separate with the consequence that position 1 has the highest value. It means that stress and
strain will finally concentrate in the α phase particularly near the phase boundary. Thus,
failure will initiate preferentially at these regions.
![]()
Fig.12. Effective strain rate evolutions of position 1 (near phase boundary), 2,
and 3 (at grain center) in the α grain along the selected path.
Elastic plastic deformation of TC6 titanium alloy analyzed by in-situ synchrotron based X-ray
diffraction and microstructure based finite element modeling
Journal of Alloys and Compounds 688 (2016) 787-795
[ PDF
Document Download ]
文献10(2016): Determination of the single-phase constitutive relations of α/β dual phase
TC6titaniumalloy(α/β双相TC6钛合金单相本构关系测定)
In the EPSC framework, the evolution of strain is determined for unidirectional strain loading in
strain steps of 0.1%.Tocorrelate the orientation of single crystals with those on
polycrystalline samples, crystallographic data are described by means of three Euler angles
which are commonly used to describe the sample orientation relative to the crystal. For
orientation measurements in Channel 5, the convention of Bunge is applied. The Euler angles:
φ1,Φ,φ2 represent a rotation f φ1 about the z-axis, followed by a rotation of Φ about the
rotated x-axis and followed by a rotation of φ2 about the rotated z-axis.Therefore, a set of
discrete Euler angles of 6495 α grains and 2341 β grains are specified and weighted, based on
the EBSD orientation distribution measurement. EBSD crystalline orientation maps (Inverse pole
figures, IPFs) (Fig. 4) are colored according to the initial crystallographic orientation of
each grain in the polycrystalline material paralleling to the LD of the sample within the
coordinate system comprised by three important low-index axes.
![]()
Fig.4. Crystalline orientation maps of (a) α phase and(b)of β phase.
The SF frequency distributions of slip systems in the α grains(Fig. 5) increase from hard(i.e.,
lowest-SF,SF=0) orientations to soft(i.e.,highest-SF,SF=0.5) orientations. These four slip
systems occur with frequencies of 61.98%, 55.06%, 84.18%,and 85.52%, respectively, in grains
with SF values higher than 0.3. Plastic deformation occurs preferentially in high-SF grains. The
orientations of these grains are referred to as favorably oriented components. Furthermore, with
increasing deformation, the reorientation of deformed grains results in the rotation of
unfavorably oriented grains to favorably oriented components. Sustainable plastic deformation of
the α phase is initiated at a relatively large time scale.
![]()
Fig.5. Schmid factor maps and histograms of slip systems in the α grains:
(a){0001}< 1120> basal, (b){1010}< 11..0>
prismatic, (c){1011}< 1120> first-order
pyramidal, and(d){1011}< 1123> second-order pyramidal slip
systems.
Determination of the single-phase constitutive relations of α/β dual phase TC6titaniumalloy
Materials Science & Engineering A 675(2016)138–146
[ PDF
Document Download ]
文献11(2010): High temperature deformation behavior of the TC6 titanium alloy under the uniform DC
electric field(TC6钛合金在均匀直流电场作用下的高温变形行为)
The microstructures of the fractured TC6 which are obtained by furnace cooling from 600℃, 700℃
and 800℃ to the room temperature, are shown in Figs.5, respectively. These microstructures can
indirectly reflect the structure features of the TC6 during the stretching deformation process
at the high temperature stage. Through these microstructures we can find obvious tensile
deformation of the primary α phase and extraordinary uneven proportional distribution of the
phases when the external electric field is not applied. However, at the same temperature more
uniform distribution and finer secondary α phase precipitate from β phase when the external
electric field is applied. As a result, these secondary α phase will relax the stress
concentration and promote the coordination deformation of the grains. Obviously, the external
electric field promotes the dynamic recrystallization of TC6 during the tensile process,
homogenizing the distribution of second α phase, and retarding the partial growth of α grain
thus coordinating the deformation of the grains at 600℃, 700℃ and 800℃. Form the above
discussion, the conclusion can be reached that the ductility of TC6 are improved by the external
electric field at 600℃, 700℃ and 800℃.
![]()
Fig. 5. Microscopic patterns of the TC6 at 600℃/700℃/800℃ under different
electric field.
High temperature deformation behavior of the TC6 titanium alloy under the uniform DC
electric field
Journal of Alloys and Compounds 489 (2010) 401–407
[ PDF
Document Download ]