文献1(2015):Simulation of damage and failure processes of thermal barrier coatings subjected to a
uniaxial tensile load(热障涂层在单向拉伸载荷作用下的损伤和失效过程的模拟)
The geometrical shape of a selected section of the tested fracture surface (300.0×243.1μm) is
represented by a 2D isometric image and a 3D topographical map, as shown in Fig. 9(a) and (b),
respectively. The results show that the convex sections (labeled as “A”) correspond to the
exposed bond coat, whereas the concave areas (labeled as “B”) correspond to the adherent top
coat, and the difference in height between them is approximately 20–35μm.
![]()
Fig.9. Fracture morphology obtained by an optical profilograph: (a) 2D isometric
image and (b) 3D topographical map.
The formation and propagation of the primary crack inside the top coat are shown in Fig. 14. At
time t = 44.4 s from initial application of the load, the generated microcracks at the TC/BC
interface [labeled as “I”, “II”, “III”, and “IV”, see Fig. 14(a)] propagate, amalgamate, and
begin to form a primary crack, as shown in Fig. 14(b). This moment corresponds to the peak value
of internal energy shown in Fig. 8. The inset in Fig. 14(b) displays the first principle stress
vectors at the crack tip; tensile stress in the z-direction can be seen very clearly. As a
result, the primary crack propagates horizontally inside the top coat along the interface
direction, that is, normal to the vertical tensile stress. The specific crack propagation path
is illustrated in Fig. 14(c).
![]()
Fig.14. Initiation and propagation of the primary crack: (a) microcracks at the
TC/BC interface, (b) formation of the primary crack, and (c) propagation of the primary crack

Simulation of damage and failure processes of thermal barrier coatings subjected to a
uniaxial tensile load
Materials and Design 86 (2015) 89–97
[ PDF
Document Download
]
文献2(2015):Experimental Study and Numerical Simulation of the Tensile Test for GH4169 Coated with
YSZ Coating at High Temperature(YSZ涂层的高温合金GH4169拉伸试验研究与数值模拟)
At time t=120s from initial application of the load, stress concentration mainly occurred in the
YSZ ceramic top coating where the maximum tensile stress reached about 200 MPa. The maximum
principal stress vectors at this moment show the presence of an axial stress of typical elements
parallel to the loading direction, which is equally distributed through the thickness.
Simultaneously, coating material was subjected to a radial stress (the intermediate principal
stress which was much lower), which increased toward the interface between YSZ and bond coating,
where the failure of coating was more liable to occur. As the applied load continued to
increase, at t=180s, the maximum tensile stress eventually exceeded the tensile strength of YSZ,
triggering severe debonding failure in the center region of the specimen.
![]()
Fig.5 The initial debonding failure of YSZ coating: (a) stress contours of the
model at t=120s; (b) the maximum principal stress vectors inserted in Fig.5(a); (c) the
intermediate principal stress vectors inserted in Fig.5(a); (d) coating delamination in the
center region of the specimen.
Fig.7(a) shows the stress contours at t=780s, where it is seen that the residual coating can
apparently change the stress distribution inside the metal substrate. The tensile stress of
substrate with coating was nearly 40% lower than that without coating. Therefore, it can be
concluded that YSZ coating can relieve stress significantly, thus helping prolong the
substrate's service life in the same environment. As we can see from Fig. 7(b), residual YSZ
coating near the interface was subjected to a vertical or oblique tensile stress, which induces
further interfacial debonding failure, shown in Fig. 7(c). With the increase of external
loading, at t=900s, only a few residues can be seen at the arc transitional region (Fig. 7(d)).
![]()
Fig.7 The final debonding failure of YSZ coating: (a) stress contours of the
model at t=780s; (b) the maximum principal stress vectors inserted in Fig.7(a); (c) the
interfacial debonding failure of the residual coating; (d) residues at the arc transitional
region
Experimental Study and Numerical Simulation of the Tensile Test for GH4169 Coated with YSZ
Coating at High Temperature
Applied Mechanics and Materials 782(2015)237-244
[ PDF
Document Download
]
文献3(2013):Lifetime prediction of plasma-sprayed thermal barrier coating
systems(等离子喷涂热障涂层系统的寿命预测)
The growth of the TGO (thermally grown oxide) is an important phenomenon responsible for the
spallation failure of TBC. During isothermal oxidation in Tmax, TGO forms and grows at the top
coat/bond coat interface. A series of scanning electron microscopy (SEM) micrographs over 200
images at 2000 magnifications is taken to identify the TGO thicknesses for each statistical
cycle number listed in Table 2. Fig. 2a–d shows typical SEM micrographs of TGO growth after
different thermal cycles. Subsequently, the statistical method is used to identify the average
thickness of TGO. It shows that the average thickness of the TGO is 1.62μm after 8 cycles. With
thermal cycles and exposure time increasing, the TGO thickness increases. When thermal cycling
increases to 850 cycles (850 hour exposure time), the average thickness of the TGO accumulation
is up to 6.50μm, which is approximately fourfold over the thickness after 8 cycles.
![]()
Fig.2. Typical SEM micrographs of TBC after isothermal oxidation and thermal
cycles revealing the growth of TGO. (a) 100 cycles; (b) 200 cycles; (c) 600 cycles; and (d) 850
cycles
Fig. 13 shows the 1st stress distribution in TC at room temperature during 900 cycles. The peak
of 1st stress reaches 222 MPa in region C, where is the most vulnerable part in TBC. According
with the simulation results, microcrack growth observed in the similar region where is away from
macrocracks observed in the surface of TBC by naked eyes is shown in Fig. 14 after 850 cycles.
During 810–900 cycles, the peak of 1st stresses in TC will reach the failure stress, hence, the
lifetime of TBC is determined between 810 and 900 cycles with the TGO thickness between 6.4 and
6.6μm, which agrees with experimental average lifetime 860 cycles. Because the interface model
with periodic boundary conditions is effectively modeled as infinite series of undulation
morphological characteristics r(i), the TBC life predicted by FEM can reflect the experimental
result effectively.
![]()
Fig.13. The maximum principal stresses in TC with 900 thermal cycles and Crack
growth in similar region C.
Lifetime prediction of plasma-sprayed thermal barrier coating systems
Surface & Coatings Technology 217 (2013) 39–45
[ PDF
Document Download
]
文献4(2012):Effects of defects on the effective thermal conductivity of thermal barrier
coatings(缺陷对热障涂料有效导热系数的影响)
A typical microstructure of plasma sprayed TBCs from the cross-section view by scanning electron
microscopy (SEM) is shown in Fig. 4. It includes yttria partially stabilized zirconia (YSZ) and
defects. The model size is 120μm × 90μm within the total porosity fraction of 3.68%. A finite
element grid model with more than 40,000 quadrilateral elements in Fig. 5a based on the actual
microstructure of TBCs is generated by digital image processing theory and finite element mesh
generation principle. The results indicated that the effect of the longest transverse crack is
smaller than all the other defects combined together. However, the longest transverse crack
still by all odds plays the most important role for the effective thermal conductivity of TBCs
along the spray direction than any individual defect.
![]()
Fig.4. The cross-section microstructure of TBCs and the finite element grid
model of TBCs with (a) all defects inside, CK = 1763μm2, D = 2160μm2. (b)
only No.1 defect
inside, CK (1) = 956μm2, D(1) = 956μm2.
Effects of defects on the effective thermal conductivity of thermal barrier coatings
Applied Mathematical Modelling 36 (2012) 1995–2002
[ PDF
Document Download
]
文献5(2011):Finite element simulation of tensile bond strength of atmospheric plasma spraying
thermal barrier coatings(气体等离子喷涂热障涂层抗拉结合强度的有限元模拟)
As is seen in Figure 5, the strain localization region is readily observed in the direction of 45
°, leading to the formation of the adiabatic shear band. When the α phase proportion outside the
shear band is varied from 13.8%~46%, with the increase of the α phase proportion, the strain
localization region decreases. For the α phase proportion of 13.8%, it has the largest strain
localization region, the highest strain is more than 2.9, and the initiation of apparent cracks
are observed; however, when the α phase proportion increases to 46%, the highest strain is lower
than 0.7, and the strain localization region almost disappears. In order to further study the
phenomenon, influence of the α phase proportion outside the shear band on adiabatic shear
sensitivity is calculated. The results show that as the α phase proportion changes from 13.8% to
46%, the crack initiation time is varied from 40.1μs to 46.2μs, and the difference of crack
initiation time is up to 6.1μs, which indicates the α phase proportion outside the shear band is
the key factor that dominates the adiabatic shear sensitivity of equiaxed titanium alloys and
the adiabatic shear sensitivity decreases with increasing α phase proportion within a certain
proportion of α phase. The research further shows that since the α phase has a better uniform
plastic deformation ability than the β phase has, with the increase of the α phase proportion,
the uniform plastic deformation ability increases, resulting in a decreased tendency of strain
localization, thus the adiabatic shear sensitivity decreases.
![]()
Fig.5.(a) Maximum tensile stress distribution in the beginning of crack growth.
(b) Cracks growth at 33.2 s. (c) Cracks growth at 33.6 s. (d) Fracture at 34 s.
Sometimes, fracture even occurs in TC away from the interface, as shown in Fig. 6. The long
transverse cracks in TC at or near TC/BC interface are found to be the most vulnerable parts of
APS TBCs. When loads are gradually applied to a solid body, they will lead to the deformation of
the material. Provided no energy is lost in the form of heat, the external work done by the
loads will be converted into internal work called strain energy. When loads are gradually
applied to TBCs, the strain energy goes up correspondingly. With increasing the load, the stress
intensity at the crack tip rises until a threshold value and the crack grows uncontrollably.
Meanwhile, a large number of elements satisfied with failure criterion are deleted from the
model, and thus, the strain energy releases quickly.
![]()
Fig.6.(a) The cross-section microstructure of APS TBCs. (b) Simulation results
of fracture
Finite element simulation of tensile bond strength of atmospheric plasma spraying thermal
barrier coatings
Surface & Coatings Technology 205 (2011) 2964–2969
[ PDF
Document Download
]
文献6(2010):Proposal of new expressions for effects of splat interfaces and defects on effective
properties of thermal barrier coatings(溅射界面和缺陷对热障涂层有效性能影响新表达式的提出)
In this paper, over 200 images are selected and more than 70,000 quadrangle elements are used in
each finite element mesh, as shown in Fig. 4(a) and (b). Fig. 4 shows distributions of stress in
spray direction and thermal gradient under steady-state conditions, grey color represents normal
regions (1± 20% σ0 or 1±20% ΔT/h) not affected by defects, while other colors
indicate nonlinear
stress region and thermal gradient region. In Fig. 4 (c) and (d), the stress contours and
thermal gradient contours clearly illustrate the effects of defects. There are obvious
concentrations of stress and thermal gradient around defects. Generally, higher stresses or
thermal gradients contribute to lower effective Young's modulus or thermal conductivity. The
Young's modulus and the thermal conductivity of the coating in the spray direction namely Ee and
Ke are measured as 56 GPa and 1.08 W/mK, respectively.
![]()
Fig.4. Finite element model and distributions of stress and thermal gradient.
(a) A SEM cross-section image of YSZ coating (212μm × 159μm). (b) Finite element model according
with SEM image. (c) Stress profile. Grey color represents normal region (1 ± 20% σ0)
not affected
by defects, while other colors indicate nonlinear stress region Ω. (d) Thermal gradient profile.
Grey color represents normal region (1 ± 20%ΔT/h) not affected by defects, while other colors
indicate nonlinear thermal gradient region Ψ.
Three artificial finite element models with dimensions 25 μm×25 μm and more than 20,000 elements
are designed in Fig. 5: all of the defects are idealized and assumed to be spheroid elements
with the aspect ratios of b/ a=0.6 (a and b are major and minor axes, a=0.7 μm) in Fig. 5(a);
all of the interfaces are idealized and assumed to be rectangle elements with the size of 3.25
μm×0.125 μm in Fig. 5(b); Fig. 5(c) shows the model containing defects and interfaces together.
A comparison between effect coefficients of defects and splat interfaces, namely α and β, shows
that the Young's modulus effect coefficient of splat interfaces is more than triplicate effect
coefficients of defects, indicating that splat interfaces have much greater influences on the
Young's modulus than defects. Comparing ϕ and φ it can be found that the splat interfaces makes
more contribution than defects in defining the thermal conductivity of plasma sprayed Coatings.
![]()
Fig.5. Finite element models used to estimate effective properties and effect
coefficients. (a) Idealized spheroid elements representing the defects in coatings. (b)
Rectangle elements representing the splat interfaces in coatings. (c) The model containing
defects and interfaces together.
Proposal of new expressions for effects of splat interfaces and defects on effective
properties of thermal barrier coatings
Surface & Coatings Technology 204 (2010) 3376–3381
[ PDF
Document Download
]
文献7(2010):基于数字图像处理技术的等离子喷涂氧化锆涂层热导率影响因素有限元研究(Finite Element Study of Influence Factors on Thermal
Conductivity of Plasma Sprayed Zirconia Coatings Based on Digital Image Processing)
可通过灰度阈值分割技术识别涂层显微图像内部的陶瓷材料、孔洞及裂纹等。 灰度阈值分割是最常见的图像分割处理方法。图1(a)为氧化锆涂层SEM
照片,图中暗区代表了孔洞和裂纹,而亮区则表示陶瓷。将二元图像转化成矢量化的显微组织结构并导入有限元分析软件中,生成与涂层显微组织相一致的有限元模型,
如图1(c)所示,从而在氧化锆涂层隔热性能计算中考虑了材料的非均质性。
![]()
图1 涂层截面与有限元网格模型
图2(a)为涂层的温度梯度▽T分布云图。缺陷的存在一方面改变了温度梯度在涂层中的分布,使得在缺陷的周围存在明显的温度梯度集中区,从而有效地降低了涂层的热导率;另一方面,高的温度梯度也会导致高的应力区域的出现,降低了涂层的力学性能。图2(b)为涂层中的最大主应力分布图,深色区域为应力集中区,是陶瓷层中最薄弱的部分,当应力积累到一定程度时,裂纹会由此迅速扩展,并最终导致涂层失效。
![]()
图2 涂层温度梯度(a)与第一主应力(b)分布图
文献8(2010):基于涂层显微组织图片的拉伸实验有限元数值模拟(Finite Element Simulation of Virtual Tensile Experiment Based
on Microstructural Images of Coating)
图5 为不同时刻的裂纹扩展图。t =46.8 s时,裂纹从A 点位置开始扩展,此时的拉应力载荷为78.0MPa;t =53.1
s时,横向裂纹贯穿整个模型,该区域内的涂层已被拉断,此时的拉应力载荷为88.5MPa。图6 表明,随着拉应力载荷不断增加,应力在裂纹尖端处迅速积累.当涂层内部应力达到失效应力时,首先从A
端点处裂纹开始迅速向左侧扩展;然后B 点和C 点处裂纹开始向右侧扩展,同时孔隙b
处裂纹开始向上纵向扩展;最终横向裂纹贯穿整个涂层,涂层被拉断裂纹的扩展方式以横向扩展为主,涂层最终断裂方式为层裂.裂纹扩展导致涂层失效的过程中,横向主裂纹α
起了主导作用,而纵向裂纹和孔洞的贡献很小。
![]()
图5 不同时刻裂纹扩展图
采用轴向拉伸法研究相同喷涂工艺得到TBCs的失效形式。图7为拉伸断裂ZrO2陶瓷层断口形貌图,在断口面上微裂纹较多,喷涂过程中形成的横向微裂纹是导致涂层失效的主要原因。实验表明,断裂发生在陶瓷层内部,断裂形式为层裂。实验结果与模拟结果基本一致。值得说明的是,由于实际涂层的拉伸断裂失效因素很多,除了ZrO2陶瓷层的显微组织形貌外,还受到涂层内部界面结合状态等因素的影响。
![]()
图7 拉伸断裂ZrO2 陶瓷层断口形貌图
文献9(2009):基于显微组织图片的涂层热导率有限元计算研究(Finite Element simulation of Thermal conductivity Based on
Microstructural Images of Thermal Barrier Coatings)
先通过扫描电子显微镜(
SEM)得到ZrO2涂层横截面的局部位置放大物理图像文件,然后选取图像中某一特定区域,利用灰度阈值分割处理方法将整个图像分成2个部分,转化成一个二值图像。根据下面的算式,得到一个二值图像。随后根据不同的像素点灰度值对应着不同的材料组元,将像素点单元的集合转换成有限元网格单元的集合,建立得到网格单元数为125
×100的有限元网格模型,大小为125μm ×100μm。
![]()
图1 ZrO2涂层横截面显微组织图像、灰度分割二值图及有限元网格模型
ZrO2涂层稳态温度场分布如图4所示。图4表明,由于孔洞、裂纹的存在及其分布的不均匀性,导致了涂层稳态温度场的分布也极不均匀。尤其在孔洞、裂纹附近,温度梯度相对较大。孔洞、裂纹等缺陷的存在影响了涂层热量的传递。孔隙的存在降低了涂层的有效热导率;等离子喷涂ZrO2涂层中沿喷涂方向较垂直喷涂方向具有更低的热导率,低的热导率决定了ZrO2涂层沿喷涂方向具有更优的隔热性能。分析ZrO2涂层图片的显微组织结构,裂纹分布以横向为主。裂纹的横向分布阻碍了热流的纵向传播,从而降低了涂层的纵向热导率,提高了涂层的隔热性能。涂层热导率受孔隙率和孔隙形状共同影响。
![]()
图4 ZrO2涂层稳态温度场分布图
文献10(2009):Modeling of micro-crack growth during thermal shock based on microstructural images
of thermal barrier coatings(基于热障涂层微观结构图像的热冲击微裂纹扩展模拟)
A typical microstructure of plasma sprayed TBCs from the cross-section view by scanning electron
microscopy (SEM) is shown in Fig. 1. The model size is 240μm× 180μm. It includes YSZ TC and
NiCoCrAlY BC with the dark color indicating defects of voids and micro-cracks. Such an image can
be transferred to a digital image by digital image processing technology. A finite element grid
model in Fig. 2 based on the actual microstructure of TBCs is generated by thresholding
segmentation and finite element mesh generation principle. This finite element model is made up
of 180 135 finite elements, and the dimensions are 240μm× 180μm.
![]()
Fig.1. The cross-section microstructure and the finite element grid model of
TBCs
After 25 thermal shock cycles, the micro-crack growth caused by high temperature gradient and
different CTE is shown in Fig. 3. Due to high temperature gradient and the existence of defects,
the tensile stresses in the horizontal direction are induced during thermal shock, so vertical
cracks initiated in the TC are developed, thus causing spallation of the TC finally. The
presence of vertical cracks can relieve residual stress, thus enhance TBCs thermal shock
resistance and prevent further delamination of TC. However, the large delamination crack in the
TC makes it transparent to oxygen, and hence the thermally grown oxide (TGO) is easily formed at
the interface of the TC and BC during high-temperature exposure. As shown in Figs. 3 and 4, a
comparison between experimental results and numerical results shows that after 25 thermal shock
cycles, the crack growth in simulation result agrees well with the corresponding experimental
result. The methodology in our present work is effective to model the micro-crack growth.
![]()
Fig. 3. Simulation result and experimental result of micro-crack growth after 25
thermal shock cycles.
Modeling of micro-crack growth during thermal shock based on microstructural images of
thermal barrier coatings
Computational Materials Science 46 (2009) 600–602
[ PDF
Document Download
]
文献11(2009):Molecular dynamics calculation of thermal expansion coefficient of a series of
rare-earth zirconates(稀土锆酸盐热膨胀系数的分子动力学计算)
Fig.3 shows the equilibrium-location deviations versus different potential energy differences
relative to the ground state for Zr–O, O–O, and serial A–O bonds. Among these different atom
pairs, or bonds, it is found that the Zr–O bond is the most important factor in determining the
overall TECs of different pyrochlore zirconates, and the A–O bond plays a secondary role.
However, O–O has little effect on the TECs.
![]()
Fig.3. Equilibrium-location deviations for different potential energy
differences, relative to the ground state.
Fig.4 shows the pyrochlore structure and the fluorite structure of Er2Zr2O7. It can be seen that
the minimum-length bond in the fluorite structure is the Zr–O bond, which at 2.2985 Å is longer
than in the pyrochlore structure (2.0324 Å). The longer the bond is, the weaker the bond is.
Correspondingly, the minimum-length bond of a crystal structure reflects the strongest bonding
strength in the crystal structure. In addition, for the same chemical composition with different
phase structures, the anharmonicity effects are approximately the same since the same set of
potential parameters are used. In such a case, the weaker the bonding strength, the larger the
TEC. So, bonding strength is another important factor that affects TECs. Therefore, the fluorite
structure has a higher TEC.
![]()
Fig.4. Crystal structure of Er2Zr2O7.
Molecular dynamics calculation of thermal expansion coefficient of a series of rare-earth
zirconates
Computational Materials Science 46 (2009) 716–719
[ PDF
Document Download
]
文献12(2008):Prediction of the intrinsic thermal conductivity of phonons in dielectric and
semiconductor materials based on the density of the lattice vibration
energy(基于晶格振动能量密度预测介电和半导体材料中声子的本征热导率)
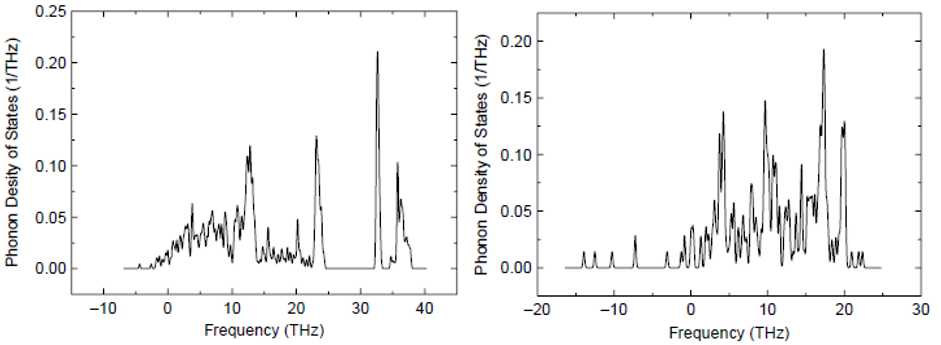
Figures2 show the phonon DOS of α-SiO2 and cubic ZrO2 (c-ZrO2),
respectively. Based on
the
phonon DOS results, the heat capacity can be calculated from Equation (2), as shown in Figure 3.
The agreement with experimental data is found to be good. A comparison between the calculated
and experimental thermal conductivities shows that the calculated values of Si,
α-SiO2, and
La2Zr2O7 are reasonably good. Although there were some
differences between the calculations and
experiments for Ge and c-ZrO2, these were probably caused by the calculation of the
phonon DOS,
or phonon scatter effects due to various defects in the crystals. It is still a first-step
methodology to calculate the intrinsic phonon thermal conductivity of perfect-crystal dielectric
and semiconductor materials through theoretical calculation without the need to input any
experimental data
![]()
Figure 2. Phonon DOS of a-SiO2 and cubic ZrO2.
![]()
Figure 3. Heat capacity of a-SiO2 and cubic c-ZrO2.
Prediction of the intrinsic thermal conductivity of phonons in dielectric and semiconductor
materials based on the density of the lattice vibration energy
Molecular Simulation 34(2008):1129-1132
[ PDF
Document Download
]
文献13(2008):Study of ZrO2 phase structure and electronic
properties(ZrO2的相结构和电子性质的研究)
To compare the charge distribution characteristics for three ZrO2 polymorphs, the
charge
distribution on a typical plane is presented in Figures 6–8, respectively. Figure 6 shows the
charge distribution on a typical c-ZrO2 plane with miller index (1 1 -2) and across
the point
(2.53, 2.53, 2.53); Figure 7 shows the charge distribution on a typical t-ZrO2 plane
with miller
indices (0 1 0) and across the point (1.82, 1.82, 2.64); and Figure 6 shows the charge
distribution on a typical m-ZrO2 plane with miller indices (20.68 0.68 20.27) and
across the
point (2.48, 2.56, 2.20). As shown in these figures, the maximum charge density for
c-ZrO2,
t-ZrO2 and m-ZrO2 is 5.098, 7.234 and 7.261 electrons/ Å3,
respectively,
which is agreement
with phase stability tendency at ground state. Namely, the larger the maximum charge density is,
the stronger the bonding strength is, and the more stable the phase is.
![]()
Fig.6. Charge distribution on a typical plane of c-ZrO2 and
t-ZrO2 and m-ZrO2
文献14(2008):Splat Formation of Plasma Sprayed Functionally Graded YSZ/NiCrCoAlY Thermal Barrier
Coatings(等离子喷涂功能分级的YSZ/NiCrCoAlY热障涂层的溅射形成)
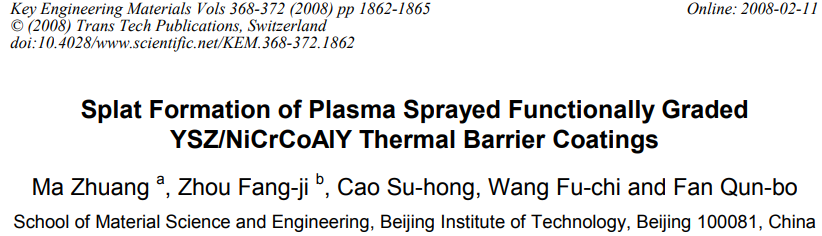
Fig.1 shows the splat formation SEM photographs of varying mass fractions of YSZ and NiCrCoAlY
deposited by plasma spray process parameters shown in Tab.1. According to the Tab.1, when
increasing the ratio of YSZ by 20 percent, increasing I and FHe and decreasing
FAr, YSZ powder
melt better, as seen in the Fig. 1. A relatively complete ball YSZ powder can be seen (shown in
Fig.1a) and the size of YSZ powder un-melted is big. The size of un-melted one in 40% YSZ /60%
NiCrCoAlY gets smaller (shown in Fig.1b) and its shape is quite different from original ball
powder. Likewise, Fig.1c shows that size of un-melted YSZ powder in 60% YSZ /40% NiCrCoAlY get
further smaller and even certain big size original YSZ powder melts totally. Splat formation
morphology of 80% YSZ /20% NiCrCoAlY is similar to that of 60% YSZ /40% NiCrCoAlY, as shown in
Fig.1d. Original YSZ powder that can melt totally is much bigger than that shown in Fig.1c.
![]()
Fig.1 Splat morphology of ZrO2/NiCrCoAlY
Fig.2 shows the results of the corresponding plasma jet temperature fields mentioned above in
Fig. 1. The horizontal X axis stands for distance from one position on gun axis to gun exit and
the vertical Y axis stands for plasma jet temperature (T). The temperature at gun exit is
defined as T0. With respect to Fig.2a-d, T0 demonstrates the increasing tendency in spray
process parameters in Tab.1, which reaches individually 8890K, 10500K, 10900K and 12300K.
Furthermore, the same tendency appears at each value along X axis. In conclusion, increasing I
and FHe and decreasing FAr, T takes on an increasing tendency. In hotter
plasma jet background,
thermal conductivity from jet to powder is so effective that powder melts better and splat
spreads more easily.
![]()
Fig.2 Plasma jet temperature field by the four process parameters in Tab.1. (a)
I=600A, FAr=120SCFH, FHe=15SCFH; (b) I=700A, FAr=110SCFH, FHe=15SCFH; (c) I=700A, FAr=100SCFH,
FHe=25SCFH; (d) I=800A, FAr=85SCFH, FHe=315SCFH
Splat Formation of Plasma Sprayed Functionally Graded YSZ/NiCrCoAlY Thermal Barrier Coatings
Key Engineering Materials 368-372(2008)1862-1865
[ PDF
Document Download
]
文献15(2008):Perturbation Molecular Dynamics Simulation of Thermal Conductivity of
Zirconia(氧化锆热导率的微扰分子动力学模拟)
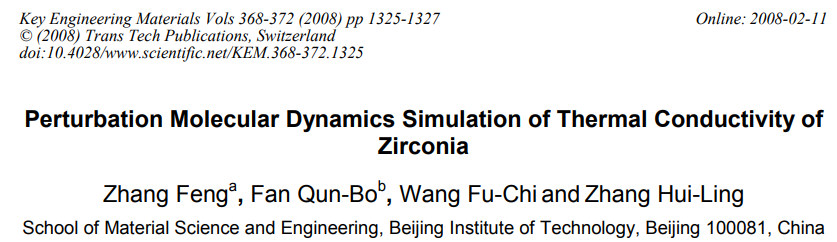
Fig.2 shows the calculated thermal conductivity for ZrO2 and YSZ. It can be seen that
the
significant decrease in thermal conductivity caused by Y2O3 addition. In
addition, it’s found
that with increasing the temperature, the thermal conductivity always decreases both for
ZrO2
and for YSZ. After taking photon conductivity into account, shown in Fig.3, thermal conductivity
at temperatures higher than 1200K is found to be rising, instead of always decreasing to a
certain value, which successfully reproduces the experimental observations. By contrasting
calculated thermal conductivity and experimental ones reported by literatures, it can be found
that the calculated values are relatively higher.
![]()
Fig.2 Phonon thermal conductivity of ZrO2 and YSZ(a)before and
(b)after taking
photon conductivity into account
Fig.4 shows instantaneous lattice constant of ZrO2 as a function of temperature. It
can be seen
that the instantaneous lattice constant fluctuates around a line which was fit to describe the
theoretical relation between lattice constant and temperature. Linear thermal expansion
coefficient of a material can be calculated by dividing the slope of the fit line with the
initial lattice constant. Calculated and experimental values are compared in Table 2. It can be
seen that the calculated results are smaller than the experimental ones. But the increment of
thermal expansion coefficient caused by Y2O3 addition is reproduced well.
In spite of possible
calculation errors for thermal expansion coefficient, the method proposed in this paper is still
acceptable.
![]()
Fig.4 Instantaneous lattice constant of ZrO2 as a function of
temperature
Perturbation Molecular Dynamics Simulation of Thermal Conductivity of Zirconia
Key Engineering Materials 368-372(2008)1325-1327
[ PDF
Document Download
]
文献16(2007):稀土锆酸盐焦绿石相结构的第一原理计算(First-principle calculations of rare earth Pyrozirconate
structure)
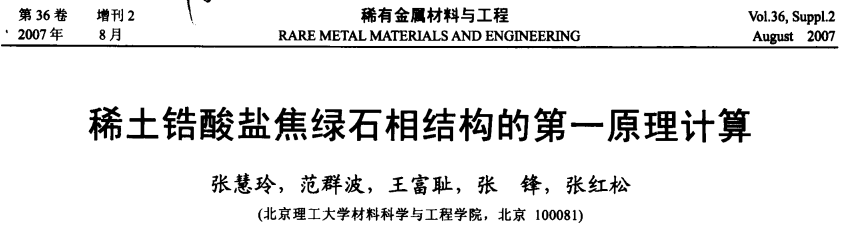
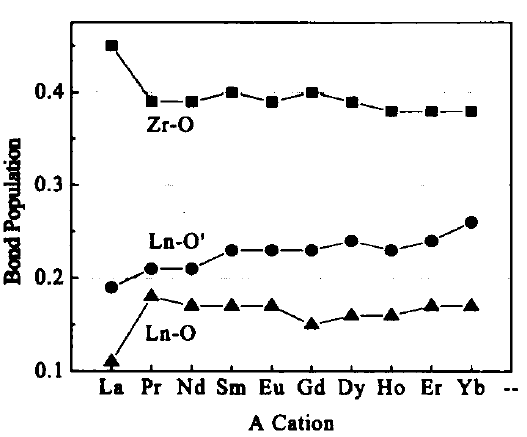
Mulliken键集居数是反映原子间作用力的有效工具,从
Mulliken集居数的计算结果(图5)可以看出在各稀土锆酸盐焦绿石结构中Zr-O键最强,Ln-O较弱,LnO最弱,该现象是O48f偏移引起键长畸变的结果。随着原子序数的增加Zr-O键有所减弱,说明其受到x增大的影响;Ln-O’键则有明显增强,说明其受到晶格收缩的影响。而键强最小的Ln-O键变化则较复杂,它并未因为晶格收缩,及x的增大而明显增强。
![]()
图5 键集居数随A位原子序数变化
本研究通过计算焦虑石结构的粉末XRD图谱,并与实际粉末的XRD实验结果进行比较进一步验证结构计算的准确性。图6为Sm2Zr2O7粉末的XRD图谱,可以看出,本文计算出的结构与实际粉末十分吻合,不仅衍射峰位置一一对应,而且峰强与轮廓也较准确。最强峰位于2915°,焦绿石的5个特征峰分别在14.45°、27.90°、36.95°、44.35°、50.90°。
![]()
图6 焦绿石相Sm2Zr2O7粉末XRD计算、实验结果比较
文献17(2007):功能梯度热障涂层隔热与应力缓和的组合设计(Integration design of heat insulation and stress relaxation for
FGM thermal barrier coatings)
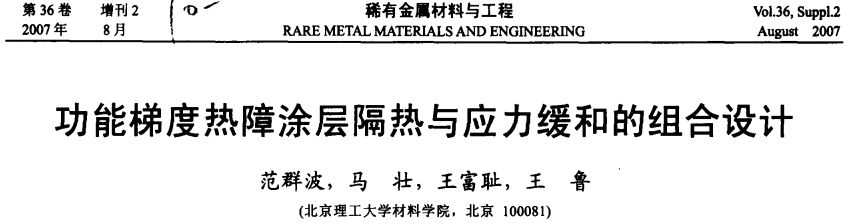
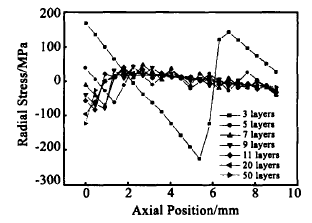
图6为不同层数的功能梯度材料径向热应力沿轴向位置的变化曲线。由图可知,材料径向热应力轮廓呈锯齿状且应力峰值在梯度层界面附近。3层材料的最大径向拉应力值为167MPa,远远大于5层材料44MPa,当材料层数大于5层时,随着层数的增加,径向热应力变化渐渐趋于平滑,界面处应力集中情况得到缓和。
![]()
图6 径向热应力沿轴向变化曲线
图7为轴向热应力沿轴向位置的变化曲线,变化趋势与径向应力类似。材料轴向热应力轮廓呈锯齿状且应力峰值出现在梯度层界面附近。随着材料层数的增加,轴向应力显著降低,5层材料的最大拉应力(56MPa)仅为3层材料(275MPa)的20%。
![]()
图7 轴向热应力沿轴向变化曲线