文献1(2019):Macro segregation and the underlying mechanism in
Ti-6.5Al-1.0Cr-0.5Fe-6.0Mo-3.0Sn-4.0Zr alloy(Ti-6.5Al-1.0Cr-0.5Fe-6.0Mo-3.0Sn-4.0Zr合金的宏观偏析及其机理)
Fig. 4 shows the three-dimensional maps of the content distributions of Mo (Fig. 4a), Al (Fig.
4b), Fe (Fig. 4c) and Sn (Fig. 4d) on the longitudinal section of the
Ti-6.5Al-1.0Cr-0.5Fe-6.0Mo-3.0Sn-4.0Zr alloy ingot. The distribution difference of each element
in the 64mm×72mm area was clearly observed. For example, Mo and Sn were more abundant at the top
of the longitudinal section, whereas the distributions of Al and Fe were relatively uniform. The
3D map of Sn shows the most pronounced gradient, indicating that the segregation of Sn was the
most severe out of all the measured elements. Meanwhile, the content distributions of all
elements had anomalously low values, close to 0, in similar positions.
![]()
Fig.4. Three-dimensional maps of the content distributions of (a) Mo, (b) Al, (c)
Fe, (d) Sn on the longitudinal section of the ingot
Fig. 5 shows the two-dimensional maps of the content distributions of Mo (Fig. 5a), Al (Fig. 5b),
Fe (Fig. 5c) and Sn (Fig. 5d) on the longitudinal section of the
Ti-6.5Al-1.0Cr-0.5Fe-6.0Mo-3.0Sn-4.0Zr alloy ingot. This allows to quantitatively present the
component distributions in different regions, i.e., the content of each element at any position
(X, Y) on the section. It can be seen that the distribution of Sn shows the biggest
fluctuations. Its average content was 2.852%, but the highest content exceeded 3.8%. Sn was more
abundant in the upper region (X ˜ 4–43,Y ˜ 65–72), where its content was higher than 3.254%, and
more scarce (lower than 2.608%) in the lower region (X ≈ 12–58, Y ≈ 4–9). Its maximum and
minimum
contents were 3.816% at (11, 70) and 0.667% at (15,71), respectively. In comparison, the
distribution of Al in the section was more uniform: a certain degree of enrichment was
noticeable only in the region (X ≈ 20–30, Y ≈ 55–63). The average content of Al was 6.539%, with
maximum and minimum values of 7.468% and 1.854%, respectively, which appeared in the positions
(33, 60) and (15, 71). Similarly, the lowest amounts of Fe and Mo were both found at (15,71) and
equal to 0.027% and 0.001%, respectively.
![]()
Fig.5. Two-dimensional maps of the content distributions of (a) Mo, (b) Al, (c)
Fe and (d) Sn on the longitudinal section of the ingot.

Macro segregation and the underlying mechanism in Ti-6.5Al-1.0Cr-0.5Fe-6.0Mo-3.0Sn-4.0Zr
alloy
Progress in Natural Science: Materials International 29 (2019) 224–230
[ PDF
Document Download
]
文献2(2011):Effects of electric pulse heat treatment on microstructures and dynamic deformation
behaviors of Ti6441 alloys(电脉冲热处理对Ti6441合金组织和动态变形行为的影响)
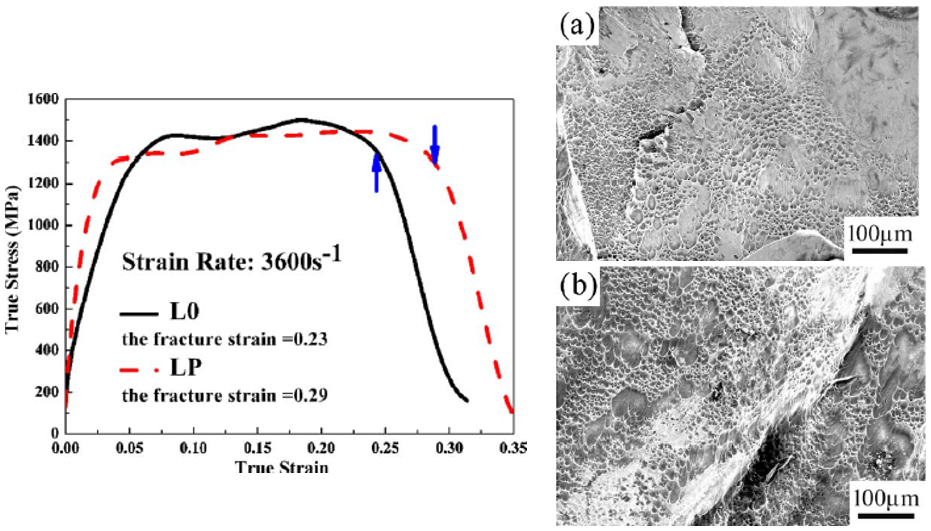
As shown in Fig. 6, although the dynamic strength retains nearly the same high level, the LP
microstructure undergoing EPH treatment performs much outstanding dynamic ductility with 29% in
the fracture strain, in contrast with the L0 microstructure having the fracture strain of 23%,
at the 3600 s-1 strain rate. This means that at the same strain rate, the LP
microstructure can
absorb much more energy due to the augment of fracture strain during the dynamic compression
deformation process, showing the increase of load bearing time in contrast with L0
microstructure. As prior beta grains, alpha colonies, alpha plates and fine acicular alpha
precipitates are refined, the significant increase of alpha/beta phase interfaces in LP lamellar
microstructures has an advantageous effect on avoiding the stress concentration at the boundary
of alpha/beta phase, because each alpha/beta interface is assigned to less stress. Hence, the LP
microstructure can bear much longer time before fracture failure than the L0 one at the strain
rate of 3600 s-1, showing the better dynamic ductility.
![]()
Fig.6. Stress–strain curves obtained from the dynamic compression test and SEM
fractography of the dynamically fractured specimens for the (a) L0 and (b) LP microstructures,
respectively
Fig. 8 presents dynamic shear voltage–time curves of the Ti6441 hat-shaped specimens at the
strain rate of 3000 s-1, and the arrows in the curves indicate the maximum load
bearing time
points of Ti6441 alloys with L0 and LP microstructures, respectively. As it can been seen in
Fig. 8, the LP lamellar microstructure can bear 58μs, which is much longer than the L0 one at a
load bearing time of 43μs, indicating the susceptibility to the ASBs declines after EPH
treatment, well agreeing with the aforementioned dynamic compression analysis. ASBs analyses
reveal that comparing to the L0 microstructure, the LP microstructure with thinner alpha
colonies and alpha plates after EPH treatment much severely hinders the ASBs growth, inducing
the ASBs strongly deflects at the boundary of alpha colonies, correspondingly causing the
bifurcation of ASBs and the increase of ASBs propagation path
![]()
Fig.8. Voltage–time curves for the forced shearing specimens under the same
strain rate and SEM micrographs of ASBs within (a) L0 and (b) LP microstructures of Ti6441
hat-shaped specimens.
Effects of electric pulse heat treatment on microstructures and dynamic deformation behaviors
of Ti6441 alloys
Materials Science and Engineering A 530 (2011) 161–167
[ PDF
Document Download
]
文献3(2010):锻造工艺对 Ti-6Al-4V-4Zr-Mo 合金绝热剪切敏感性的影响(Effects of Forging Processing on Adiabatic
Shearing Sensitivity of Ti-6Al-4V-4Zr-Mo Alloy)
钛合金经过α+β 锻造与β 锻造后的显微组织如图3 所示。从图3a 中可以看出,α+β 锻造得到了等轴状组织,为均匀分布的混合组织,其中有初生α 相和(α+β)混合体,晶粒尺寸为5 μm
左右。形成这种组织的主要原因是:在α+β 锻造过程中同时发生α 与β 晶粒形状的变化,β 晶粒被压扁,并沿着金属流动的方向被拉长、破碎,在一定温度与变形程度下开始发生再结晶现象,再结晶后的α
晶粒呈现扁球状,而一些未能完全进行再结晶的α 晶粒呈纤维状或杆状。从图3b 中可以看出,β 锻造得到的显微组织为网篮状组织,其晶粒尺寸较大,并有部分原始β
晶界残留,晶界不完整、不清晰。这是由于β
锻造的温度高于该合金的相变点,因此最后形成的显微组织为网篮组织。由于变形温度较高,导致了晶粒不断长大。另外,已被打碎的晶粒有重结晶现象发生,因此最终形成晶粒尺寸较大、组织不均匀的网篮状微观组织。
![]()
图3 不同锻造工艺处理后的微观组织
图4 分别为2种试样在应变率为1800,2250,2750s-1时动态剪切的时间-电压曲线。从图4a可看出,在应变率1800 s-1条件下2
种试样均承受了80μs
而未出现应力塌陷,即二者均未发生绝热剪切破坏;当应变率升高到2250 s-1 时,如图4b 所示,β锻造后的试样的承载时间为57.6μs,即在57.6μs
时出现了应力塌陷,发生了剪切破坏,而α+β锻造后的试样仍能完整承载80μs,即没有剪切现象出现;如图4c 所示,当应变率达到2750 s-1时,2
种试样均出现了应力塌陷,但α+β锻造后的试样承载时间较β锻长。
![]()
图 4 2种试样在同一应变率下动态剪切的电压-时间曲线