首页 >> 最新研究动态 >> 基于多尺度晶体塑性有限元模型的钛合金冷轧过程中的晶粒形貌及织构演变
基于多尺度晶体塑性有限元模型的Ti-5.5Mo-7.2Al-4.5Zr-2.6Sn-2.1Cr合金冷轧过程中的晶粒形貌及织构演变
发布时间:2021-12-06 发布人:材仿空间 研究文献发布相关信息
论文题目: Texture evolution and slip mode of a Ti-5.5Mo-7.2Al-4.5Zr-2.6Sn-2.1Cr alloy during the cold rolling process based on multiscale crystal plasticity finite element model
发表时间:Available online 17 November 2021
发表期刊: Journal of Materials Science & Technology [ 点击下载PDF ]
研究文献内容展示
Fig. 5 shows the 3D morphologies, effective stress contours, and effective strain contours at different times. To intuitively compare, the legend ranges of effective stress/strain contours in Fig. 5(a)-(d) are the same. When the ROI reaches the roll bite (i.e., t/4, see Fig. 5(a)), the effective stresses in the α and β phases are ~1000 MPa and ~1050 MPa, respectively, which are greater than the respective yield strengths (i.e., α phase: 990 MPa, β phase: 1020 MPa, see Fig. 1(b)). Therefore, two phases have underwent plastic deformation, exhibiting the effective strains are larger than 0.02. As shown in Fig. 1(b), the α phase has a higher elastic modulus (slope of the linearly elastic stage) and a lower yield strength than the β phase. Thus, the local stress in the α phase will transfer to the β phase in plastic deformation process, thereby leading to the significant load partitioning in the β phase at t/4. Furthermore, the preferential strain partitioning takes place in the α phase, which is attributed to that the overall CRSSs value of this phase is lower than that of the β phase (see Table 2). As shown in Fig. 5(b) and (c), the ROI is in the rolling plastic deformation zone at t/2 and 3t/4. The effective stress in the α phase remains at the lower value, and the effective strain is at a peak level. The thickness of the ROI along the ND progressively decreases and reaches a minimum value of 5.60 μm at 3t/4. There is an inverse increasing trend along rolling direction (RD), which widens from 7.01 μm (at t/4) to 7.80 μm at 3t/4. In addition, the effective stresses of two phases continue to increase, and then are partially released when the rollers are localized close to the exit zone of the ROI (i.e., 3t/4, see Fig. 5(c)). The effective strain contour results reveal that the local strains in the α and β phases monotonically increase and converge to the targeted 20% thickness reduction at 3t/4. Afterward, as the calculation time increases to t, most grains yield and the local stress of the ROI is sufficiently released (see Fig. 5(d)). Furthermore, the elastic rebound will occur after removing the rolling force constraints, which causes the effective strains of two phases to fluctuate and eventually remain at ~18.5%.
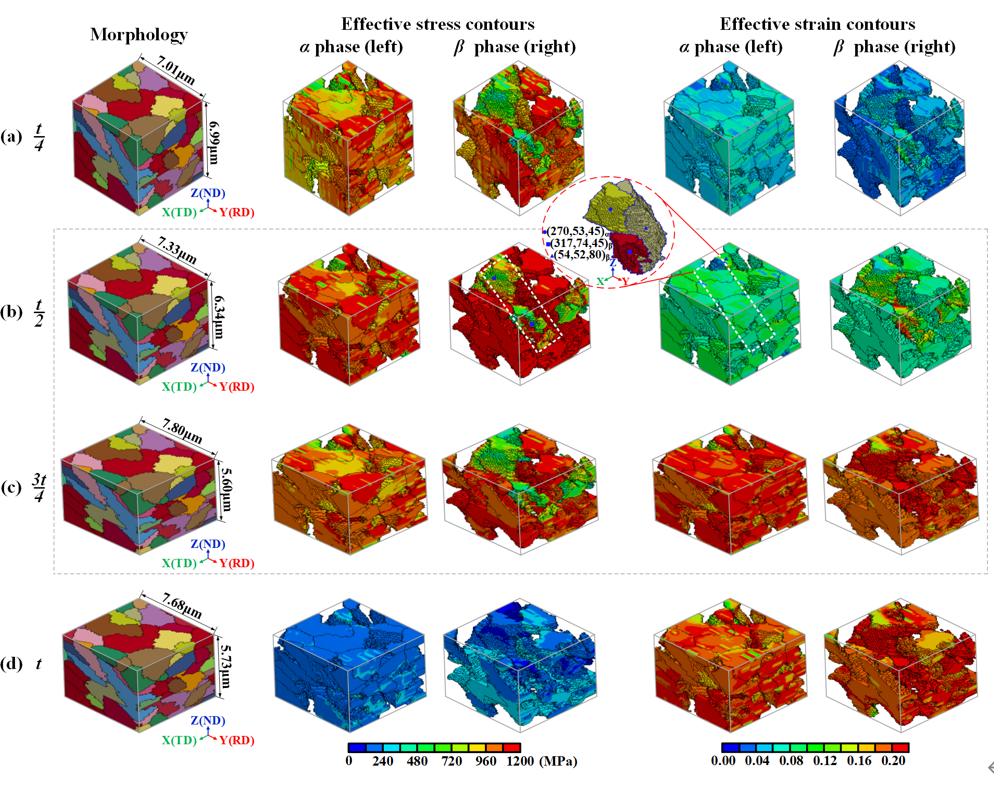
Fig. 5. 3D morphologies, effective stress contours, and effective strain contours at different times: (a) t/4, (b) t/2, (c) 3t/4, and (d) t.
Fig. 7 shows the microstructural characteristics of the Ti-5.5Mo-7.2Al-4.5Zr-2.6Sn-2.1Cr alloy after 20% cold rolling via EBSD. Fig. 7(a) and (c) show the crystalline orientation maps of the α and β phases, respectively. Compared with the initial state (see Fig. 3), the equivalent circle diameter distribution after cold rolling becomes more concentrated within 10 μm and exhibits a slight refinement behavior (α: 4.835 μm, β: 4.251 μm, see the corresponding inset). Fig. 7(b) shows the {0001}, {10-10}, and {-12-10} experimental pole figures of the α phase after cold rolling. The normal direction of the pole figures is parallel to the ND of the specimen. The maximum intensity of the α phase is less pronounced, which decreases from 7.83 Multiples of Uniform Density (MUD) to the value of 4.41 (see Fig. 3(c)). This may be attributed to the reorientation behavior of grains under the applied rolling load and, hence, the α grains rotate and deviate from the initial prominent orientation. Fig. 7(d) shows the {001}, {011}, and {111} experimental pole figures of the β phase after cold rolling. The maximum intensity of this phase significantly increases to 10.41 MUD (compared with a lower value of 5.73 in Fig. 3(d)). As shown by the red pentagrams in the {0001} and {011} pole figures, the rotation axes of the α and β phases during cold rolling are (360,90,90) and (252.25,39.3,85.6), respectively. Obviously, the numerically predicted texture components and rotation axis of the α phase are exactly consistent with the experimental results (see Fig. 6(a)). For the β phase, there is some discrepancy between the numerically cold-rolled pole figures and respective experimental observations (see Fig. 6(b)), which may be attributed to the additional challenge of considering each grain orientation detected by EBSD. Afterward, the predicted rotation axis result of the β phase indicates that the three Euler angle values of (250,41,84) are within acceptable errors of 5%, thereby verifying the prediction reliability. In addition, the pre-existing Burgers orientation relationship in Fig. 3 can also be observed in the cold-rolled microstructure (see the red dashed circles in Fig. 7(b) and (d)).
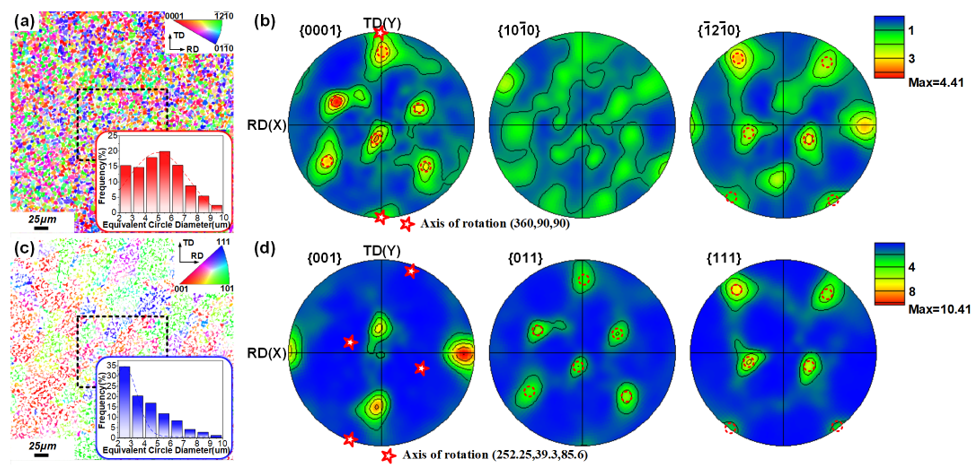
Fig. 7. Cold-rolled microstructural characteristics via EBSD: crystalline orientation maps of the α phase (a) and β phase (c), histogram of grain size distribution as inset respectively, and texture pole figures for: (b) {0001}, {10-10}, and {-12-10} α phase, (d) {001}, {011}, and {111} β phase.
To further analyze the abnormal deformation behavior in Fig. 5, Fig. 13 shows the interaction of three typical grains at different times. Fig. 13(a) shows the effective stress contours of a special α grain with initial Euler angle of (270,53,45) and the β grains (initial Euler angle: (317,74,45) and (54,52,80)) whose grain boundaries are marked with the solid lines. The interaction directions between the α and β grains are indicated by the arrows based on the first principal stress contour analysis near grain boundaries. For the (270,53,45)α grain, the local intragranular stress of the region neighboring abnormal β grains is significantly lower than that of other regions, indicating the occurrence of strong grain interactions. It should be pointed out that the overall effective stress in two abnormal β grains remains at a lower value, which is not in perfect agreement with the peak stress level of the corresponding phase in Fig. 5. Fig. 13(b)-(d) show the qualitative investigation of the activated slip systems of the (270,53,45)α, (317,74,45)β, and (54,52,80)β grains at different times, respectively. As shown in Fig. 13(b), for the (270,53,45)α grain, the maximum shear strain increments of activated slip systems in 0-t/4 and 3t/4-t are 1.53 and 1.89, respectively. In contrast, the corresponding values of t/4-t/2 and t/2-3t/4 (representing the main plastic deformation times of the ROI) are prominently high (20.33 and 41.11, respectively), indicating that the shear strain increments are positively correlated to the macroscopic deformation history of the alloy. As shown in Fig. 13(c) and (d), the positive correlation can also be observed in abnormal β grains. Furthermore, the dominant slip directions of the (317,74,45)β and (54,52,80)β grains during individual time periods are close to the local tensile directions exerted by the (270,53,45)α grain (see the blue and red arrows in Fig. 13(a), respectively). The two abnormal β grains are subjected to the stronger force from the (270,53,45)α grain and, hence, a specific slip occurs along the same direction as the driving force. This simulation result is consistent with the experimental observation that the β grains are compelled to rotate by the α grains in Fig. 8.
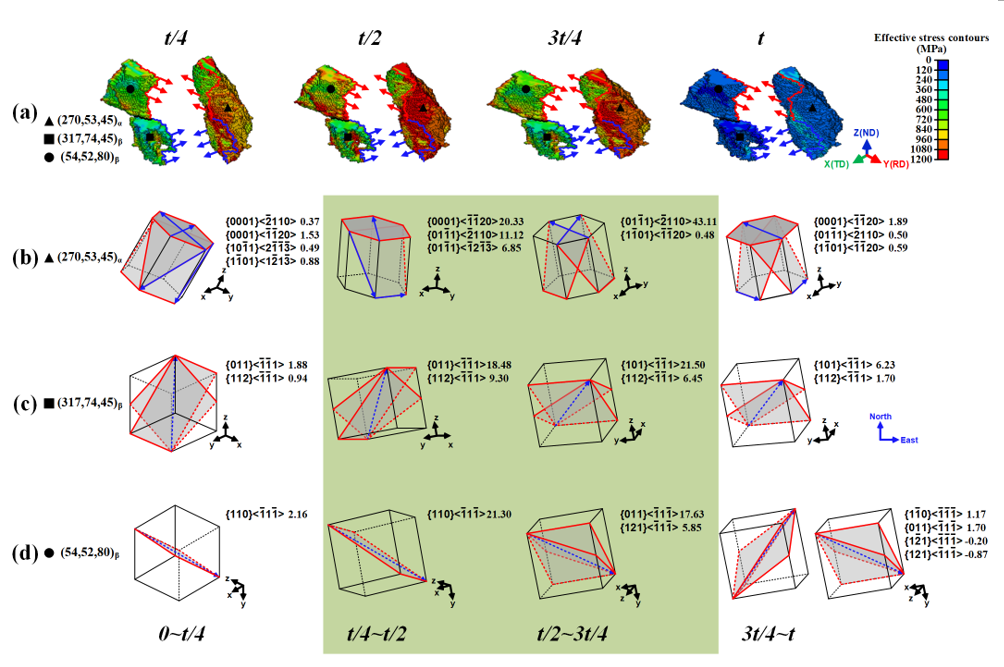
Fig. 13. Interaction of three typical grains at different times: effective stress contours (a) and slip system activations for (270,53,45)α (b), (317,74,45)β (c), and (54,52,80)β (d).

京公网安备 11010802033099号
京ICP备2020038205号-1