首页 >> 最新研究动态 >> 新型高强超高塑性钛合金的成分设计与塑性变形机制研究
新型高强超高塑性钛合金Ti-6Mo-3.5Cr-1Zr的成分设计与塑性变形机制研究
发布时间:2022-06-29 发布人:材仿空间 研究文献发布相关信息
论文题目:Composition design of a novel Ti-6Mo-3.5Cr-1Zr alloy with high-strength and ultrahigh-ductility
发表时间:Available online 29 May 2022
发表期刊: Journal of Materials Science & Technology [ 点击下载PDF ]
研究文献内容展示
The Ti-6Mo-3.5Cr-1Zr (wt.%) was designed based on the concept of multi-effect coupling. Fig. 1 displays the Md - Bo map based on the D-electrons theory, in which various zones with distinct plastic deformation mechanisms are divided by transition lines, such as β/ β+ ω , β+ ω / βtw , Martensite start ( Ms ), Martensite finish ( Mf ), Martensite stress-induced ( Md ), and α+ β/ β lines. By adjusting the relative content of the three alloying elements Mo, Cr, and Zr, the position of the alloy composition in this work corresponds to the overlap between the twinning, ω phase transformation, and dislocation slip zones. Therefore, the alloy was expected to exhibit both high strength and εf through the combination of the TRIP, TWIP, and dislocation strengthening effects during the plastic deformation process.
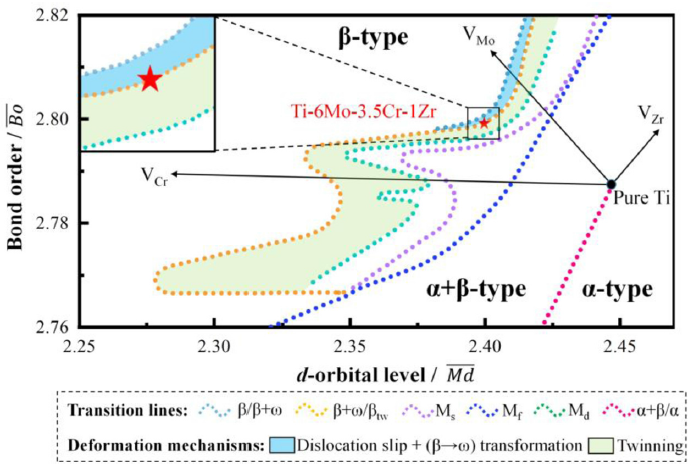
Fig. 1. D -electrons design map showing the position of the Ti-6Mo-3.5Cr-1Zr alloy.
The EBSD maps of the in-situ tension experiment are illustrated in Fig. 4 . We paused the tensile test when doing the data collection. However, it might be noted that the specimen was not removed from the in-situ stretching instrument, so as to ensure that the stress would not be unloaded. The yield strain and yield strength of the specimen are between 1.25%–1.5% and 680–700 MPa respectively according to the in-situ true stress–strain curve ( Fig. 4 (a)), which are consistent with the ex-situ curves. The alloy shows no obvious microstructural changes during the elastic deformation stage and still consists of equiaxed βgrains ( Figs. 4 (b, c) and S1 in the Supplementary Material). However, during the plastic deformation stage, a band structure is formed and its volume fraction increased with the accumulation of strain ( Figs. 4 (d, e) and S1). According to the phase map, the band structures are determined as the hexagonal structure ( Fig. 4 (f)). EBSD and TEM characterizations (see Section 3.4 for details) were combined to identify this type of band structure as the SIω phase. The orientation relationship between the SIω and the β matrix is (1-101)SIω//(110)β(Fig.4(g)). Prior to the rotation of the β matrix, the grains of the SIω phase start to rotate at low strain and their texture along the tensile direction change from (01-10) to (-12-10) and (0001) ( Fig. 4 (h)). For comparison, the texture of the βphase remains relatively unchanged ( Fig. 4 (i)).
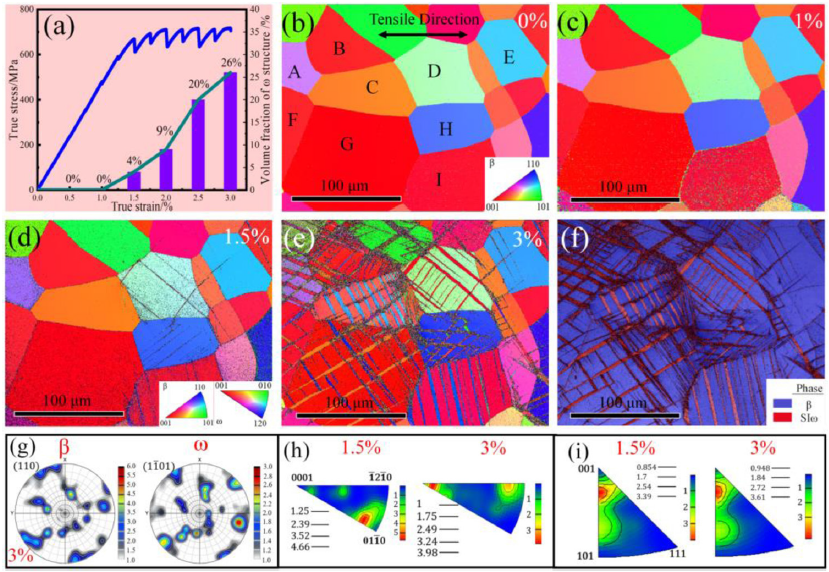
Fig. 4. In-situ EBSD analysis of the alloy at 0%–3% strain. (a) True stress–strain curve of the in-situ tensile test and the variation of the stress-induced ω volume fraction with different macro strains. (b–e) Orientation distribution maps at 0%, 1%, 1.5%, and 3% strains, respectively. (f) Phase map at 3% strain. (g) Pole Figure (PF) comparison of (110)β and (1-101)SIω at 3% strain. (h, i) Inverse Pole Figure (IPF) comparison between the 1.5% and 3% strains for the ω and βphases, respectively.
After comparing the IPF map ( Fig. 6 (a)) and the phase map ( Fig. 6 (b)) under 5% strain, a part of the bands in grain A is revealed as BCC structures. The boundary misorientation between the βmatrix and these bands is determined to be ∼50.5° from the inset in Fig. 6 (a), which is the boundary characteristic of {332} <113> βtw. Additionally, secondary bands are discovered in the primary bands ( Fig. 6 (c)). The density of the geometrically necessary dislocation (GND) near the SIω zone is significantly higher than that in the βtw and β matrix zones ( Fig. 6 (d)), which indicated that the SIω zone had an obstructive effect on the movement of dislocations. At a 10% strain state, the stress-induced bands interact with each other, forming a net-like distribution ( Fig. 6 (e, f)). Interestingly, the volume fraction of these bands further increased compared to the 5% strain state. A large number of secondary bands are precipitated in almost all primary bands ( Fig. 6 (g)). Furthermore, the average GND density at this state reaches 1.22 ×10¹⁵ m-2 , which is higher than that at 5% strain (0.56 ×10¹⁵ m-2 ) ( Fig. 6 (h)). As a result, the interaction of secondary deformation mechanisms and the boundaries of primary bands attributes to the increased strain hardening.
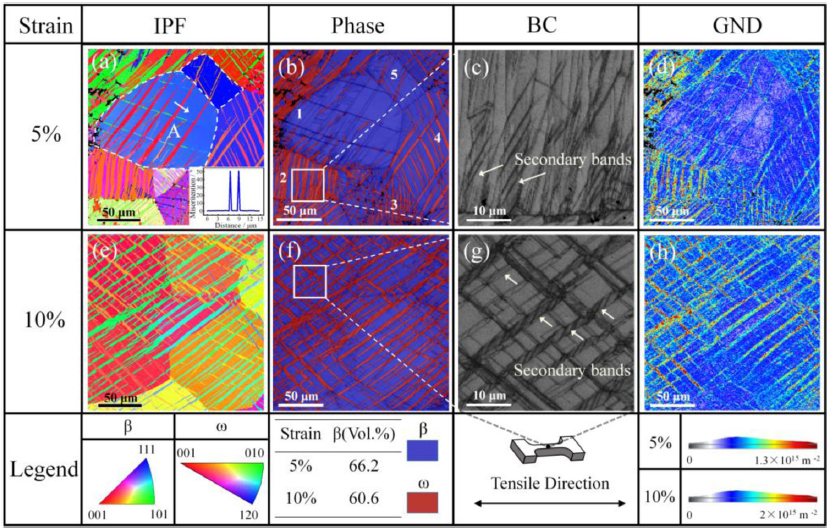
Fig. 6. Ex-situ EBSD analysis of the alloy at 5% and 10% macro strains. (a) and (e) IPF maps. (b) and (f) Phase maps. (c) and (g) BC maps. (d) and (h) GND maps.
The finer nano-scale microstructural evolution was explored by the TEM analysis. Fig. 7 (a) shows the initial formation of the SIω band at 1.5% strain. Its selected area electron diffraction (SAED) spots are discovered to coincide with those of the athermal ω1 variant that pre-existed in the matrix ( Fig. 7 (b)). The TEM darkfield (DF) images of the ω1 and ω2 variants reveal that the band interior contains more ω1 variants than the matrix, but no ω2 variants are detected inside the band ( Fig. 7 (c, d)). Therefore, it is speculated that the precipitation of the SIω band at the initial stage of plastic deformation demonstrated a variant preference, which was believed to be related to the nucleation and growth of the ω1 variant and the degradation of the ω2 variant. The bent band under 2.5% strain is determined as the ω phase ( Fig. 7 (e, f)). The deformed areas in the band verify that the newly generated SIω phase actively participates in the plastic deformation ( Fig. 7 (g)).
Fig. 7. TEM analysis of the tensile samples at different strains: (a–d) 1.5%. (e–g) 2.5%. (a, e) TEM bright-field (BF) images. (b, f) SAED pattern recorded from the red circle marked zone in (a) and (e), respectively. (c, d) DF images of the ω1 and ω2 variants based on the reflections in (b), corresponding to the dotted frame zone in (a). (g) DF image corresponding to (e).

京公网安备 11010802033099号
京ICP备2020038205号-1