首页 >> 最新研究动态 >> Ti-6Mo-3.5Cr-1Zr钛合金中一种新型的β→ω→β+α相变机制报道
Ti-6Mo-3.5Cr-1Zr钛合金中一种新型的β→ω→β+α相变机制报道
发布时间:2022-07-15 发布人:材仿空间 研究文献发布相关信息
论文题目:A novel sequential mechanism associated with stress-induced β→ω→β+α phase transformation in Ti–6Mo-3.5Cr–1Zr titanium alloy
发表时间:Available online 27 May 2022
发表期刊: Materials Science & Engineering A [ 点击下载PDF ]

研究文献内容展示
The true stress-strain curve of the alloy stretched to failure is shown in Fig. 1a. The true ultimate tensile strength and elongation to failure are measured to be 1123 MPa and 35%, respectively. XRD result shows that the as-quenched alloy is composed of β and ω phases (Fig. 1b). EBSD inverse pole figure (IPF) map and phase map detect the existence of β phase and determine its average grain size of ~95 μm (Fig. 1c and d). However, further selected area electron diffraction (SAED) reveals the existence of two nanoscale athermal ω variants in the β matrix, which cannot be detected in TEM bright-field image due to its extremely small size (Fig. 1e and inset). The orientation relationship of athermal ω phases with the β matrix satisfies [011]β//[11-20]ω1//[2-1-10]ω2. The TEM dark-field (DF) images corresponding to [000-1]ω1 and [000-1]ω2 reflections show that both variants are uniformly dispersed in β matrix, with particle diameters less than 10 nm (Fig. 1f and g).
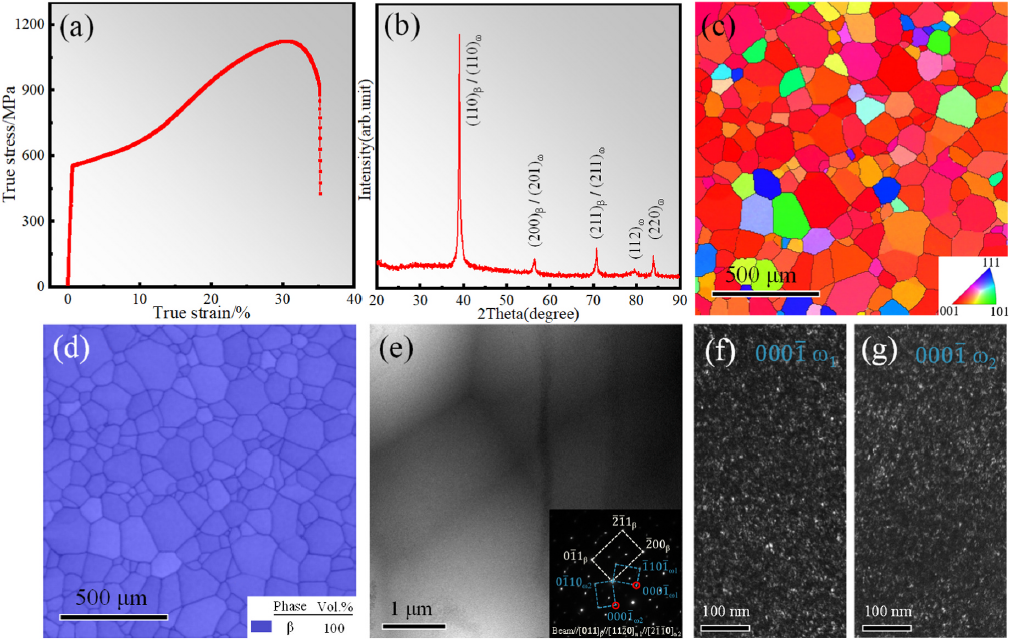
Fig. 1. Mechanical properties and microstructure analysis of the as-quenched alloy. (a) True stress-strain curve of the alloy stretched to failure. (b) XRD analysis. (c) EBSD IPF map. (d) EBSD phase map. (e) TEM bright-field image (The inset shows SAED pattern along the [011]β zone axis). (f–g) TEM dark-field images corresponding to the [000-1]ω1 and [000-1]ω2 reflections in SAED, respectively.
The true stress-strain curve of the alloy stretched up to 1.5% strain is shown in Fig. 2a. The 0.2% offset yield stress (σ0.2) is 588 MPa. The stress at 1.5% strain is 630 MPa, which is 7% higher than the σ0.2. This indicates that the material undergoes strain hardening. Both EBSD IPF map (Fig. 2b) and TEM BF image (Fig. 2d) detect the appearance of band structures. Combining the EBSD phase map (Fig. 2c) and SAED patterns corresponding to the matrix region (S1) and the band region (S2) (Fig. 2e and f), the band structure is identified as ω phase, which is induced by the external stress. In addition, the volume fraction of SIω is determined by EBSD phase map to be 4.64%. The SAED spots of SIω overlaps with those of the athermal ω1 variant that pre-exists in the matrix. The TEM DF images of the ω1 and ω2 variants reveal that the interior region in the band contains more ω1 variants than that in the matrix, but no ω2 variants are observed inside the bands (Fig. 2g and h).

Fig. 2. Microstructure analysis of the alloy at 1.5% strain. (a) True stress-strain curve. (b) EBSD IPF map. (c) EBSD phase map. (d) TEM bright-field image. (e–f) SAED patterns recorded from the S1 and S2 areas in (d), respectively. (g–h) TEM dark-field images of ω1 and ω2 variants using the reflections of (000-1)ω1 and (000-1)ω2 in (e), respectively. (i) TEM mapping images of each element (Ti, Mo, Cr and Zr) at β/ω interface. (j) Schematic diagram of the atomic shear process of β→ω phase transformation. (k) High-resolution TEM image of the interface between the stress-induced ω band and the β matrix. (l) Schematic diagram of the atomic arrangement at the interface between ωB and ωC particles in (k).
The true stress-strain curve of the alloy at a tensile strain of 5% is shown in Fig. 3a. The stresses at 1.5% strain and 5% strain are 639 MPa and 688 MPa, respectively, indicating further hardening of the material. EBSD IPF map (Fig. 3b) and phase map (Fig. 3c) show that the volume fraction of the SIω bands at 5% strain is 33.5%, which is significantly higher than that at 1.5% strain. This indicates the continued occurrence of the β→SIω phase transformation as the strain accumulates. Interestingly, TEM observations show that a series of fine lamellar structures appear inside the initial ω bands (Fig. 3d). SAED pattern implies the existence of α phase in the lamellar region (Fig. 3d inset). Furthermore, the high-resolution atomic image also shows the existence of β phase in the lamellar structure, whose orientation relationship with the α phase satisfies [011]β//[0001]α (Fig. 3e and f). The interface between the two phases exhibits a stepped feature, as shown by the yellow dotted line in Fig. 3f. Compared with the α-layer, the width of the β-layer is very small, so the diffraction characteristic associated with the corresponding β phase is not obvious in the SAED pattern. These results prove that the lamellar structure is formed by the SIω→α+β phase transformation.

Fig. 3. Microstructure analysis of the alloy at 5% strain. (a) True stress-strain curve. (b) EBSD IPF map. (c) EBSD phase map. (d) TEM bright-field image (inset shows the SAED pattern recorded from the circled area). (e–f) High-resolution TEM image of the lamellar area. (g) TEM mapping images of each element (Ti, Mo, Cr and Zr) corresponding to the lamellar area. (h) Schematic diagram of the atomic shear process of ω→α phase transformation.

京公网安备 11010802033099号
京ICP备2020038205号-1