首页 >> 最新研究动态 >> 应力诱导ω相变型钛合金在动态压缩过程中的组织演化及绝热剪切行为探究
应力诱导ω相变型钛合金在动态压缩过程中的组织演化及绝热剪切行为探究
发布时间:2022-08-08 发布人:材仿空间 研究文献发布相关信息
论文题目:Deciphering the microstructural evolution and adiabatic shearing behavior of the titanium alloy with stress-induced ω phase transformation during dynamic compression
发表时间:Available online 12 July 2022
发表期刊: Materials & Design [ 点击下载PDF ]

研究文献内容展示
In order to gain an insight into the microstructural evolution during the dynamic compression, EBSD characterization was performed. However, the sharpness resolution of the Kikuchi pattern would be significantly reduced by the high residual surface stress generated in the compressed specimens with high strain, hence, the low strain specimen of 10% strain is chosen for analysis. Its EBSD IPF map is shown in Fig. 4a, the bands with the width of 3μm~10μm run through the β grains and terminate at the grain boundaries. The bands structure can be found in the EBSD phase map (Fig. 4b), which are all hexagonal structure. These bands are generated from the body centered cubic (BCC) β matrix at relatively low strains, so the occurrence of stress-induced phase transformation can be inferred. Further TEM SAED indicates that the stress-induced bands in Fig. 4c are the ω phase (Fig. 4d). The high-resolution (HR) TEM image recorded from the [0 1 1]β axis shows the atomic arrangement at ω/β interface (Fig. 4e), in which the structural feature of the ω phase and the β phase are highlighted by orange and blue dots, respectively. The interplanar distances of (0 1 -1)β, (200)β, (0001)ω and (-1010)ω are measured to be 0.23 nm, 0.16 nm, 0.28 nm and 0.4 nm, respectively. Based on the observations of SAED and HRTEM, the orientation relationship between the ω and β phases is deduced as {-1010}ω//{211}β and [11-20]ω//[011]β, which is consistent with the orientation relationship reported in Ti-36Nb-2.2Ta-3.7Zr-0.3O (at. %) alloy.
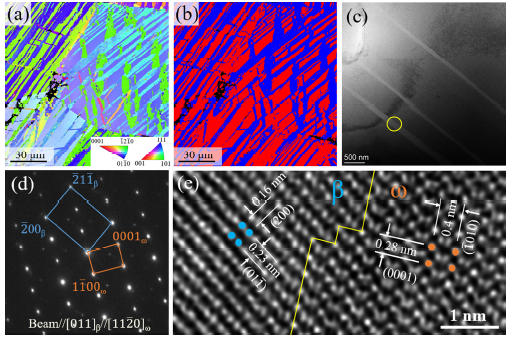
Fig.4 EBSD and TEM analysis of the band structures. (a) EBSD IPF map. (b) EBSD Phase map. (c) TEM bright-field image. (d) SAED pattern recorded from the circled area in (c). (e) HRTEM image at ω/β interface along [011]β axis. The ω and β phases are highlighted by orange and blue dots, respectively.
The formation of ASB is observed in samples with 30 % strain. The direction of the ASB is 45° from the compressive direction (Fig. 6a), and the SIω bands on both sides of ASB deform along the shear direction (Fig. 6b). In addition, the ASB in Fig. 6c-d tends to get around the stress-induced bands region and propagate along the original β grains boundaries, which results in a bifurcation at the end. This reflects the hindering effect on the ASB expansion by the stress-induced structures. These obstacles in the formation and expansion of the ASB results in a relatively high malleability of the alloy.

Fig.6 SEM observation of the adiabatic shear band. (a) Overall morphology of adiabatic shear band. (b) Enlarged view for the boxed area in (a). (c) Bifurcation at the end of adiabatic shear band. (d) Enlarged view for the boxed area in (c).
TEM observations on the transition zone of ASB are shown in Fig. 10. Lift-out method is used to prepare FIB sample in the target zone (Fig. 10a). The average grain size in F2 zone is ~300 nm (Fig. 10b). Band structures are also detected in this zone (Fig. 10c), which are confirmed as the hexagonal close packed (HCP) structure by SAED (Fig. 10d). The HRTEM image and corresponding inverse fast Fourier transform (FFT) filtered image of the band area are shown in Fig. 10e and Fig. 10f, respectively. The interplanar distances of (0110) is measured to be ~0.255 nm, which indicates that the band structure is a phase generated by recrystallization.

Fig. 10. TEM analysis of the transition zone in adiabatic shear band. (a) FIB sample prepared by lift-out method. (b) TEM BF image showing the grain size. (c) TEM BF image showing the band structure. (d) SAED pattern obtained from the circled area in (c). (e) HRTEM image of the band area. (f) The inverse FFT filtered HRTEM image of the band area.
Based on the above analysis, the microstructural evolution and failure process of the alloy during dynamic compression are schematically shown in Fig. 13. The metastable β phase undergoes a stress-induced phase transformation under the action of compressive stress. The stress-induced x bands shorten the dislocation mean free path and thus increase the flow stress of the alloy. In addition, the bands are observed to hinder the formation and expansion of ASB. The grains in ASB are substantially refined. The microstructural evolution of (β + ω)→(β + α)→(β) occurs along the outer edge → transition zone → centre of ASB region. Furthermore, numerous micro-voids are generated inside ASB, which is believed to result from a combination of the thermal softening and microstructural softening (dynamic recrystallization). The connection and expansion of these micro-voids form cracks and lead to failure of the material.

Fig. 13. Schematic diagram of microstructural evolution and failure process of the Ti-6Mo-3.5Cr-1Zr alloy during dynamic compression.

京公网安备 11010802033099号
京ICP备2020038205号-1