首页 >> 最新研究动态 >> 轧制态钛合金微观组织演化及力学性能
轧制态钛合金微观组织演化及力学性能
发布时间:2020-12-28 发布人:材仿空间 研究文献发布相关信息
论文题目: Microstructure evolution and mechanical properties of a hot-rolled Ti alloy
发表时间:30 November 2020,Accepted
DOI:10.1016/j.pnsc.2020.11.007 [ 点击下载PDF ]

研究文献内容展示
Based on the statistical data derived from Fig. 4(a), the misorientation angle distribution of grain boundaries in the central region can be obtained and is displayed in Fig. 4(g). The fraction of HAGBs in β phase is 23.4%. Moreover, the fraction of HAGBs in α phase is 27.2% and the transition from LAGBs to HAGBs is continuous. This indicates that dynamic recovery occurs mainly in β phase. In addition, relatively slight DRX also occurs in α phase. The misorientation angle distribution of grain boundaries in the position of S = 0.4 is obtained and displayed in Fig. 4(h) based on the statistically derived data from Fig. 4(b). The fraction of HAGBs in β phase is 8.4%, illustrating the occurrence of more intense dynamic recovery in β phase compared with that in the region of S = 0. Moreover, the fraction of HAGBs in α phase is 40% and the transition from LAGBs to HAGBs is continuous, indicating the occurrence of more intense DRX in α phase compared with that in the region of S = 0. The misorientation angle distribution of grain boundaries in the position of S = 0.8 is displayed in Fig. 4(i) based on the statistical data derived from Fig. 4(c). The fraction of HAGBs in β phase is 3.9%, illustrating the occurrence of extremely intense dynamic recovery in β phase. Moreover, the fraction of HAGBs in α phase is 49.9% and the transition from LAGBs to HAGBs is continuous. This indicates the occurrence of the most intense DRX in α phase compared with that in regions of S = 0 and S = 0.4. In contrast, the level of DRX in β phase in the region of S = 0.8 is the lowest among these specimens.
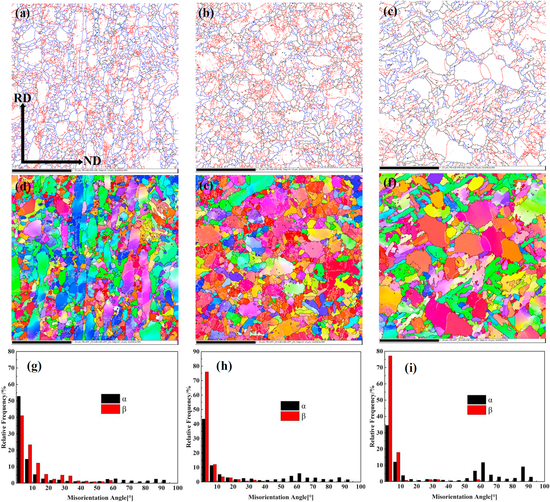
Fig. 4. EBSD grain boundary maps, grain boundaries in inverse pole figures and corresponding misorientation distribution maps of the hot-rolled titanium alloy sheet: (a), (d), (g) S = 0; (b), (e), (h) S = 0.4; (c), (f), (i) S = 0.8.
The microstructural orientation maps of α and β phases in the specimens observed from the TD are shown in Fig. 5(a)-(f). The α and β phases gradually concentrate on some orientations with the increase of distance from the central region, such as the {0001} for the α phase and {001} for the β phase.The pole figures of α and β phases in these specimens are shown in Fig. 5(g) and (h), respectively. For α phase, the strongest texture locates in the {0001} pole figure compared to that in the {01–10} pole figure and the {-12-10} pole figure, as shown in Fig. 5(g). In the central region (S = 0), the strength of the {0001}α texture is 6.99. With the increase of distance from the central region, the strength of the {0001}α texture increases to 11.29 (S = 0.4) and 20.70 (S = 0.8).

Fig. 5. Orientation maps of specimens: (a) α phase and (b) β phase of S = 0; (c) α phase and (d) β phase of S = 0.4; (e) α phase and (f) β phase of S = 0.8; (g) and (h) pole figures of α phase and β phase in the hot-rolled titanium.
In the last stage of the hot rolling process, a great number of elongated grains in all regions are fragmented into finer grains, especially in the central region. Moreover, the grain fragmentation disturbs the preferred orientation arrangement of grains concurrently, making the texture strength of α and β phases in the central region lower than that near the surface. At the same time, friction stress near the surface may weaken the strength of some textures [28], such as the {101}β texture. In addition, the level of the total DRX is higher than that near the surface due to their more driving force of the total DRX in the central region. What should be noticed emphatically here is that the DRX in α phase exhibits an increasing trend with the increase of distance from the central region, which is not consistent with the theoretical prediction and contrary to that of the β phase, as shown in Fig. 8(d). This phenomenon is attributed to the allocation of energy consisting of the accumulated deformation energy and thermal energy during the hot rolling process. With the increase of the distance from the center region, the deformation energy descends down and the local temperature becomes lower and lower gradually. Thus, the α→β phase transformation is inhibited, making the fraction of α phase increase correspondingly. Simultaneously, the driving force of DRX in α phase increases, strengthening the DRX in α phase in the regions near the surface. Therefore, the fraction of α phase and DRX in α phase exhibit an increasing trend with the increase of the distance from the central region. Furthermore, with the increase of distance from the central region, the driving force of DRX in β phase decreases. Thus, the fraction of β phase and DRX in β phase exhibit a decreasing trend.

Figure 8. Schematic of microstructural evolution along the thickness direction. (a) Original microstructure of titanium alloy. (b) Hot-rolled microstructure showing different deformation for the central region and the surface where dislocations appear. (c) DRX grains appear in the central region. (d) Microstructure after hot rolling process showing different grain size and the level of DRX for the central region and the surface.

京公网安备 11010802033099号
京ICP备2020038205号-1